
Connecting to FIDL protocols within components is a combination of capability routing and directory serving. This means that diagnosing connection issues can cover a few different layers:
- Client requests the protocol capability in its manifest.
- Provider exposes the protocol capability in its manifest.
- Component topology routes the capability from the provider to the client.
- Provider is serving the protocol on the correct handle.
- Client is attempting to connect to the correct protocol handle.
In this section, you'll explore some APIs and tools to help you find and fix problems with component connections, and monitor the long-term health of your components.
Monitoring FIDL connections
The fidlcat tool allows you to monitor and debug FIDL connections to trace
individual FIDL messages sent and received by your component. Similar to the
Fuchsia debugger (zxdb), fidlcat connects to a running debug_agent
component on the target device and monitors running processes.
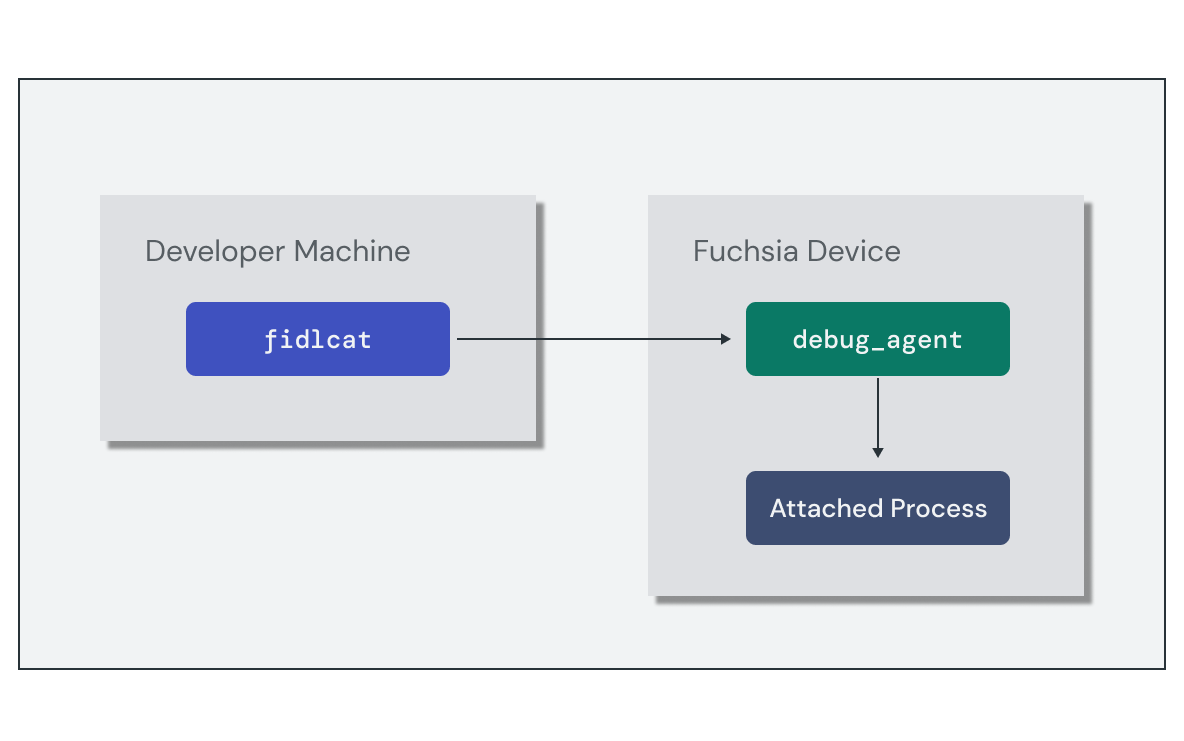
Setting up the monitoring session requires the following high-level steps:
- Run the
debug_agentcomponent on the target device. - Run the
fidlcatclient and connect to the target device.
The simplest method to start a FIDL debug session is to use the ffx debug fidl
command, which does all of these in the context of your local Fuchsia build.
However, these steps can also be performed manually if you need to configure
them separately.
Below is an example fidlcat message for a FIDL protocol request. The trace
output contains helpful information for each translation, including:
- The component or process name
- The system call invoked
- The FIDL library, protocol, and method name
- Message payload containing parameters or return values
echo-client.cm 256109:256122 zx_channel_read(handle:handle: e4c7c57f, options:uint32: 0, num_bytes:uint32: 48, num_handles:uint32: 0)
  -> ZX_OK
    received response fidl.examples.echo/Echo.EchoString = {
      response: string = "hello world!"
    }
Using Inspect
Component Inspection enables Fuchsia components to expose structured diagnostic information about themselves using the Inspect API. Fuchsia provides this information through the developer tools and bug reports to assist in diagnosing issues or monitoring performance.
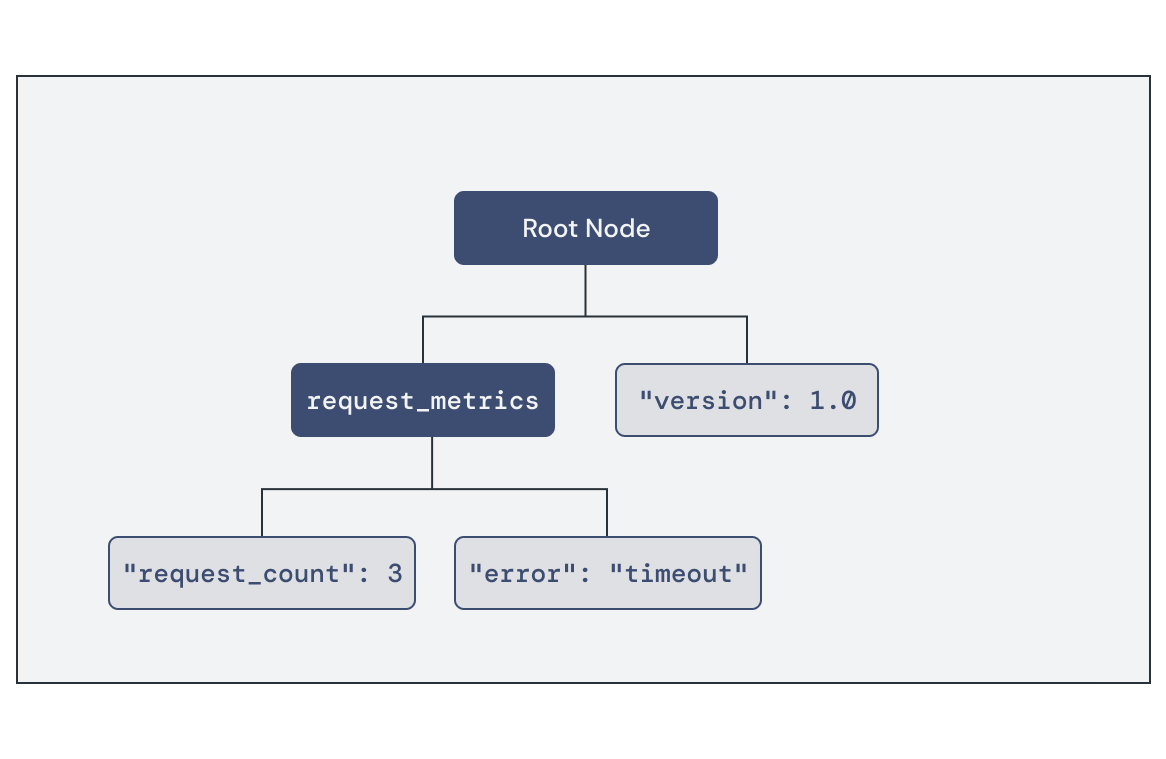
Components expose inspection metrics as a tree of named Nodes, each containing a set of Properties as key/value pairs. Properties support a variety of numeric, string, and array data types. The component inspector libraries provide an interface to your component's root node where you can attach additional properties of interest to your application.
You can retrieve the current set of metrics published to Inspect using the developer tools:
ffx inspect: Lets you interactively query the Inspect state using component selectors. This is helpful for debugging components during development.ffx target snapshot: Captures a debug snapshot archive of the entire system, which contains the Inspect data in JSON format.
ffx inspect show core/foo-examplecore/foo-example:
metadata:
filename = fuchsia.inspect.Tree
component_url = fuchsia-pkg://fuchsia.com/foo-example#meta/foo-example.cm
timestamp = 55457379176
payload:
root:
version = 1.0
request_metrics:
request_count = 3
error = timeout
Exercise: Monitoring provider components
In this section, you'll use the diagnostics tools to monitor the health and behavior of the echo server component.
Start the emulator
If you do not already have an instance running, start the emulator:
Start a new emulator instance:
ffx emu start --headlessWhen startup is complete, the emulator prints the following message and returns:
Logging to "$HOME/.local/share/Fuchsia/ffx/emu/instances/fuchsia-emulator/emulator.log"
Waiting for Fuchsia to start (up to 60 seconds)........
Emulator is ready.
Start a package server to enable the emulator to load software packages:
fx serve
Monitor FIDL traffic
You can use fidlcat to monitor and debug the FIDL connections in your
components. Launch ffx debug fidl and configure it to monitor the echo server
component:
ffx debug fidl --remote-name echo_server.cmChecking for debug agent on [fe80::d6c5:4526:c282:fb6%qemu]:2345.
Debug agent not found. Starting one.
INFO: [main.cc(238)] Connected to symbol server gs://fuchsia-artifacts-release/debug
INFO: [main.cc(122)] Connecting to port 2345 on fe80::d6c5:4526:c282:fb6%qemu...
INFO: [main.cc(92)] Connected!
Initiate a FIDL connection to the server by starting an echo client instance:
ffx component start /core/ffx-laboratory:echo-realm/echo_clientThe client binds to the server component and communicates using the Echo
FIDL protocol. Review the ffx debug fidl output to see a list of the FIDL
transactions handled by echo server:
Monitoring echo_server.cm

echo_server.cm 58694:58696 zx_channel_read_etc(handle: handle = fb9b5273, options: uint32 = 0, num_bytes: uint32 = 512, num_handles: uint32 = 4)
  -> ZX_OK
    received request fuchsia.io/Directory.Open = { flags: uint32 = 3, mode: uint32 = 493, path: string = "svc/fidl.examples.routing.echo.Echo", object: handle = Channel:f93b597b(ZX_RIGHT_TRANSFER | ZX_RIGHT_READ | ZX_RIGHT_WRITE | ZX_RIGHT_SIGNAL | ZX_RIGHT_SIGNAL_PEER | ZX_RIGHT_WAIT | ZX_RIGHT_INSPECT)(channel:0:svc/fidl.examples.routing.echo.Echo) }

echo_server.cm 58694:58696 zx_channel_read_etc(handle: handle = Channel:f93b597b(channel:0:svc/fidl.examples.routing.echo.Echo), options: uint32 = 0, num_bytes: uint32 = 512, num_handles: uint32 = 4)
  -> ZX_OK
    received request fidl.examples.routing.echo/Echo.EchoString = { value: string = "Hello, Fuchsia" }

echo_server.cm 58694:58696 zx_channel_write_etc(handle: handle = Channel:f93b597b(channel:0:svc/fidl.examples.routing.echo.Echo), options: uint32 = 0)
  sent response fidl.examples.routing.echo/Echo.EchoString = { response: string = "Hello, Fuchsia" }
  -> ZX_OK

echo_server.cm 58694:58696 zx_channel_read_etc(handle: handle = Channel:f93b597b(channel:0:svc/fidl.examples.routing.echo.Echo), options: uint32 = 0, num_bytes: uint32 = 512, num_handles: uint32 = 4)
  -> ZX_ERR_PEER_CLOSED

echo_server.cm 58694:58696 zx_handle_close(handle: handle = Channel:f93b597b(channel:0:svc/fidl.examples.routing.echo.Echo))
  -> ZX_OK
Notice the sequence of events:
- A channel to the protocol implementation opens at
svc/fidl.examples.routing.echo.Echo. - The server receives an
Echo.EchoStringrequest over the open channel, containing the string payload sent by the client. - The server sends a corresponding response with the same string payload.
- The channel closes.
By tracing the FIDL connections between your components, fidlcat enables you
to find and diagnose potential issues such as failed connections or invalid
data payloads.
Add request tracking
Component inspection allows you to publish diagnostic information from your components to assist in debugging. You'll use the Inspect API to track some usage statistics for the echo server component.
Update the echo_server request handler to accept a new struct containing
numeric Inspect properties for request count and bytes processed.
The handler increments these properties on each incoming request:
Rust
echo-server/src/main.rs:
// Inspect properties managed by the server
struct EchoConnectionStats {
    total_requests: fuchsia_inspect::UintProperty,
    bytes_processed: fuchsia_inspect::UintProperty,
}

// Handler for incoming service requests
async fn handle_echo_request(mut stream: EchoRequestStream, stats: &EchoConnectionStats) {
    while let Some(event) = stream.try_next().await.expect("failed to serve echo service") {
        let EchoRequest::EchoString { value, responder } = event;
        responder.send(value.as_ref().map(|s| &**s)).expect("failed to send echo response");

        if let Some(message) = value {
            // Update Inspect property values
            stats.total_requests.add(1);
            stats.bytes_processed.add(message.len() as u64);
        }
    }
}
C++
echo-server/main.cc:
struct EchoConnectionStats {
  inspect::UintProperty bytes_processed;
  inspect::UintProperty total_requests;
};

// Handler for incoming service requests
class EchoImplementation : public fidl::examples::routing::echo::Echo {
public:
  void EchoString(fidl::StringPtr value, EchoStringCallback callback) override {
    stats_->total_requests.Add(1);
    stats_->bytes_processed.Add(value->size());
    callback(std::move(value));
  }
  fidl::examples::routing::echo::Echo_EventSender* event_sender_;
  std::unique_ptr<EchoConnectionStats> stats_;
};
Add the following code to main() to initialize the Inspect propertes and pass
them to the updated handler:
Rust
echo-server/src/main.rs:
async fn main() -> Result<(), anyhow::Error> {
    // ...

    // Component is serving and ready to handle incoming requests
    component::health().set_ok();

    // Create request tracking properties
    let root_node = component::inspector().root();
    let stats = EchoConnectionStats {
        total_requests: root_node.create_uint("total_requests", 0),
        bytes_processed: root_node.create_uint("bytes_processed", 0),
    };

    // Attach request handler for incoming requests
    service_fs
        .for_each_concurrent(None, |request: IncomingRequest| async {
            match request {
                IncomingRequest::Echo(stream) => handle_echo_request(stream, &stats).await,
            }
        })
        .await;

    Ok(())
}
C++
echo-server/main.cc:
int main(int argc, const char** argv) {
  // ...

  // Serve the Echo protocol
  EchoImplementation echo_instance;
  fidl::Binding<fidl::examples::routing::echo::Echo> binding(&echo_instance);
  echo_instance.event_sender_ = &binding.events();

  // Create request tracking properties
  inspect::Node& root_node = inspector.root();
  auto total_requests = root_node.CreateUint("total_requests", 0);
  auto bytes_processed = root_node.CreateUint("bytes_processed", 0);
  echo_instance.stats_ = std::make_unique<EchoConnectionStats>(EchoConnectionStats{
    std::move(bytes_processed),
    std::move(total_requests),
  });

  fidl::InterfaceRequestHandler<fidl::examples::routing::echo::Echo> handler =
      [&](fidl::InterfaceRequest<fidl::examples::routing::echo::Echo> request) {
        binding.Bind(std::move(request));
      };
  context->outgoing()->AddPublicService(std::move(handler));

  // ...
}
Finally, update the imports to include the new Inspect libraries:
Rust
echo-server/src/main.rs:
use anyhow::{self, Context};
use fidl_fidl_examples_routing_echo::{EchoRequest, EchoRequestStream};
use fuchsia_component::server::ServiceFs;
use fuchsia_inspect::{component, health::Reporter};
use fuchsia_inspect::NumericProperty;
use futures::prelude::*;
C++
echo-server/main.cc:
#include <fidl/examples/routing/echo/cpp/fidl.h>
#include <lib/async-loop/cpp/loop.h>
#include <lib/async-loop/default.h>
#include <lib/fidl/cpp/binding.h>
#include <lib/inspect/cpp/inspect.h>
#include <lib/sys/cpp/component_context.h>
#include <lib/inspect/component/cpp/component.h>
Run fx build again to rebuild the component:
fx buildVerify the Inspect data
Stop the current echo-server component instance. This allows the component to
resolve the latest version from the package server the next time it starts.
ffx component stop /core/ffx-laboratory:echo-realm/echo_serverRun the echo client component multiple times. This causes the request count in
echo-server to increment with each connection:
ffx component start /core/ffx-laboratory:echo-realm/echo_clientffx component start /core/ffx-laboratory:echo-realm/echo_clientffx component start /core/ffx-laboratory:echo-realm/echo_client
View the available Inspect data for the echo server component with
ffx inspect. You'll see the values for request count and bytes processed in
the tree under the root node alongside the component health status:
ffx inspect show 'core/ffx-laboratory\:echo-realm/echo_server'core/ffx-laboratory\:echo-realm/echo_server:
metadata:
filename = fuchsia.inspect.Tree
component_url = #meta/echo_server.cm
timestamp = 1476246046122
payload:
root:
bytes_processed = 42
total_requests = 3
fuchsia.inspect.Health:
start_timestamp_nanos = 1467828507317
status = OK
Publishing health and behavior information using Inspect enables you to observe the current state of your components and diagnose issues on production devices.
Destroy the instance
Clean up the echo-realm instance using the following command:
ffx component destroy /core/ffx-laboratory:echo-realmWhat's next?
Congratulations! You've successfully built a Fuchsia IPC interface using FIDL, and connected two components together using that interface.
You have completed all the modules in this course! Take your newfound understanding to the next level and dive deeper into the: