
开发软件意味着要处理程序崩溃问题并找出 bug 的来源。Fuchsia 提供了一套工具,可帮助您识别和诊断组件中的问题,从分析崩溃日志到在核心代码中进行完整的逐步调试。
分析崩溃
Fuchsia 在启动时会启动一个名为 crashanalyzer 的程序,该程序会报告程序崩溃情况,并将崩溃线程的回溯信息输出到系统日志。虽然您可以在运行时通过查看日志直接探索这些内容,但回溯内容是使用堆栈内存地址引用进行编码的,而不是指向程序源文件中的相应行。
[klog][I] devmgr: crash_analyzer_listener: analyzing exception type 0x108
[klog][I] <== fatal exception: process crasher[42410] thread initial-thread[42424]
[klog][I] <== fatal page fault, PC at 0x1e1888dbbbd7
[klog][I]  CS:                   0 RIP:     0x1e1888dbbbd7 EFL:            0x10246 CR2:                  0
[klog][I]  RAX:                  0 RBX:                0x1 RCX:     0x721ad98697c6 RDX:     0x77accb36f264
[klog][I]  RSI:                  0 RDI:                  0 RBP:     0x2781c4816f90 RSP:     0x2781c4816f80
[klog][I]   R8:                  0  R9:                  0 R10:                  0 R11:              0x246
[klog][I]  R12:     0x773bf11dcda0 R13:     0x773bf11dcdd0 R14:               0x16 R15:         0x78050d69
[klog][I]  errc:               0x6
[klog][I] bottom of user stack:
[klog][I] 0x00002781c4816f80: f11dcda0 0000773b 9ccd2b38 000039b2 |....;w..8+...9..|
[klog][I] 0x00002781c4816f90: c4816fd0 00002781 88dbbba7 00001e18 |.o...'..........|
[klog][I] 0x00002781c4816fa0: 00000008 00000000 9ccd2b38 000039b2 |........8+...9..|
[klog][I] 0x00002781c4816fb0: f11dcf70 0000773b f11dcf70 0000773b |p...;w..p...;w..|
[klog][I] 0x00002781c4816fc0: cb36f570 000077ac f11dcdd0 0000773b |p.6..w......;w..|
[klog][I] 0x00002781c4816fd0: c4816ff0 00002781 cb2b0d0f 000077ac |.o...'....+..w..|
[klog][I] 0x00002781c4816fe0: 00000054 00000000 f11dcf70 0000773b |T.......p...;w..|
[klog][I] 0x00002781c4816ff0: f11dcfe0 0000773b 00000000 00000000 |....;w..........|
[klog][I] arch: x86_64
[klog][I] dso: id=a94c78564173530d51670b6586b1aa471e004f06 base=0x7d3506a49000 name=libfdio.so
[klog][I] dso: id=a61961ba9776a67a00fb322af9ebbdcfd1ce3f62 base=0x77accb297000 name=libc.so
[klog][I] dso: id=760f1e6e47d3dd8b6a19150aa47241279ec75a9c base=0x721ad9863000 name=<vDSO>
[klog][I] dso: id=b18462140c6784a53736105bbf3021852eeda68c base=0x1e1888dbb000 name=app:crasher
[klog][I] bt#01: pc 0x1e1888dbbbd7 sp 0x2781c4816f80 (app:crasher,0xbd7)
[klog][I] bt#02: pc 0x1e1888dbbba7 sp 0x2781c4816fa0 (app:crasher,0xba7)
[klog][I] bt#03: pc 0x77accb2b0d0f sp 0x2781c4816fe0 (libc.so,0x19d0f)
[klog][I] bt#04: pc 0 sp 0x2781c4817000
[klog][I] bt#05: end
这是因为默认情况下,在构建时,调试符号会从核心二进制文件中剥离。为了正确分析崩溃日志,您需要将这些符号重新应用于回溯,以便按源代码行号查看调用堆栈。当您调用 ffx log 命令时,开发者工具会通过一个名为 symbolizer 的附加二进制文件处理原始日志,该二进制文件会将本地 build 配置中的符号重新应用到日志中的任何回溯。
ffx log您看到的输出包含重新应用到回溯的符号:
[klog][I] devmgr: crash_analyzer_listener: analyzing exception type 0x108
... same output as "raw" backtrace ...
start of symbolized stack:
[klog][I] #01: blind_write at ../../src/developer/forensics/crasher/cpp/crasher.c:21
[klog][I] #02: main at ../../src/developer/forensics/crasher/cpp/crasher.c:137
[klog][I] #03: start_main at ../../zircon/third_party/ulib/musl/src/env/__libc_start_main.c:49
[klog][I] #04: unknown, can't find pc, sp or app/library in line
end of symbolized stack
借助正确符号化的回溯,您可以直接在源代码中发现崩溃的位置。
单步调试
仅知道程序崩溃的位置可能不足以完全诊断问题。有时,您需要逐步检查代码,甚至检查内存中变量的状态。为了支持这一点,Fuchsia 提供了名为 zxdb 的核心代码调试程序。
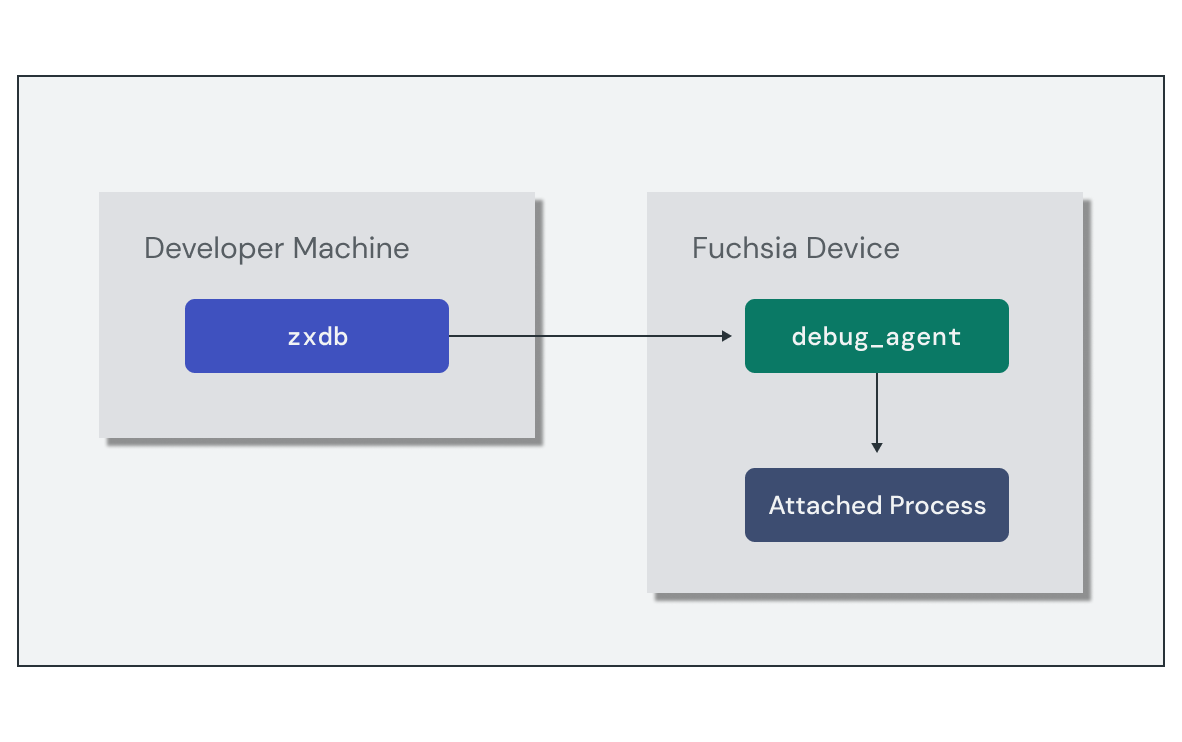
zxdb 工具是一个客户端,可连接到目标设备上正在运行的 debug_agent 组件。您可以使用 zxdb 命令配置 debug_agent 以附加到特定进程并设置断点。将调试会话附加到正在运行的进程后,zxdb 可让您逐步调试代码并检查堆栈帧。
设置调试会话需要执行以下简要步骤:
- 在目标设备上运行
debug_agent组件。 - 运行
zxdb客户端并连接到目标设备。 - 设置
zxdb的位置以查找调试符号。
启动调试会话的最简单方法是使用 ffx debug connect 命令,该命令会在本地 Fuchsia build 的上下文中执行所有这些操作。不过,如果您需要单独配置这些步骤,也可以手动执行。
调试会话处于活动状态后,系统会显示 [zxdb] 提示,以便您发出调试器命令。您可以使用 zxdb 配置 debug_agent,以使用名称过滤条件附加到进程,并设置待处理的断点,即使当前没有匹配的进程正在运行也是如此。
以下示例在 main 上设置了一个待处理的断点,以便在执行开始时停止,并等待名为“hello-world”的进程启动:
[zxdb] attach hello-world
Waiting for process matching "hello-world"

[zxdb] break main
Breakpoint 1 (Software) on Global, Enabled, stop=All, @ main
Pending: No matches for location, it will be pending library loads.
将调试器附加到进程后,您可以使用 zxdb 命令来控制和检查进程的状态。以下是一些常用命令的简短集合:
step
|
单步执行线程中的下一行代码 |
next
|
步入线程中的下一行代码 |
continue
|
继续执行,直至下一个断点、异常或退出 |
frame
|
列出或选择当前堆栈帧 |
print
|
评估表达式并输出结果 |
练习:使用 Fuchsia 调试程序
在此练习中,您将使用 Fuchsia 调试器 (zxdb) 检查 echo-args 组件的正在运行的实例,并了解崩溃的原因。
启动模拟器
如果您尚未运行任何实例,请启动模拟器:
启动新的模拟器实例:
ffx emu start --headless启动完成后,模拟器会输出以下消息并返回:
Logging to "$HOME/.local/share/Fuchsia/ffx/emu/instances/fuchsia-emulator/emulator.log"
Waiting for Fuchsia to start (up to 60 seconds)........
Emulator is ready.
启动软件包服务器,以使模拟器能够加载软件包:
fx serve
启动调试会话
模拟器启动后,使用 ffx debug connect 命令启动 zxdb 调试会话:
ffx debug connectConnecting (use "disconnect" to cancel)...
Connected successfully.
👉 To get started, try "status" or "help".
[zxdb]
成功连接后,zxdb 提示符即可接受命令。
附加到组件
在启动组件之前,请配置 zxdb 以附加到 echo-args 的实例。这样,调试器便可在进程启动后立即附加:
[zxdb] attach echo-args
在 greeting() 函数上设置断点:
[zxdb] break greeting
调试器准备就绪后,启动新的 echo-args 组件实例:
ffx component run /core/ffx-laboratory:echo-args fuchsia-pkg://fuchsia.com/echo-args#meta/echo-args.cm探索调试会话
在 greeting() 中到达断点后,执行停止,调试器等待新命令。使用 list 命令显示当前暂停执行的位置:
Rust
[zxdb] list
  18
  19 // Return a proper greeting for the list
  20 fn greeting(names: &Vec<String>) -> String {
  21     // Join the list of names based on length
▶ 22     match names.len() {
  23         0 => String::from("Nobody"),
  24         1 => names.join(""),
  25         2 => names.join(" and "),
  26         _ => names.join(", "),
  27     }
  28 }
  29
C++
[zxdb] list
  17
  18 // Return a proper greeting for the list
▶ 19 std::string greeting(std::vector<std::string>& names) {
  20   // Join the list of names based on length
  21   auto number_of_names = names.size();
  22   switch (number_of_names) {
  23     case 0:
  24       return "Nobody!";
  25     case 1:
  26       return join(names, "");
  27     case 2:
  28       return join(names, " and ");
  29     default:
print 命令将输出当前堆栈帧中任何变量的状态。打印 names 的当前值:
Rust
[zxdb] print names
vec!["Alice", "Bob", "Spot"]
C++
[zxdb] print names
{"Alice", "Bob", "Spot"}
使用 next 命令逐步执行 greeting() 函数几次:
[zxdb] next
如需让程序继续运行直至完成,请使用 continue 命令:
[zxdb] continue
退出调试会话以返回到终端:
[zxdb] exit
引入一些会导致崩溃的代码
接下来,您将向 src/main.rs 添加一些代码,以导致该组件崩溃(或出现 panic)。通过在收集实参后立即添加 assert!(false) 宏来模拟此行为:
Rust
echo-args/src/main.rs:
#[fuchsia::main(logging = true)]
async fn main() -> Result<(), anyhow::Error> {
    // ...

    // Simulate a crash
    assert!(false, "fake crash");

    // Print a greeting to syslog
    info!("Hello, {}!", greeting(&args));

    Ok(())
}
C++
echo-args/main.cc:
int main(int argc, const char* argv[], char* envp[]) {
  // ...

  // Simulate a crash
  std::strlen(nullptr);

  // Print a greeting to syslog
  FX_LOGS(INFO) << "Hello, " << echo::greeting(arguments) << "!" << std::endl;

  return 0;
}
再次运行 fx build 以重新构建组件:
fx build使用 zxdb 启动新的调试会话:
ffx debug connect调试崩溃的堆栈帧
配置调试器以附加到 echo-args 组件:
[zxdb] attach echo-args
启动组件的新实例:
ffx component run /core/ffx-laboratory:echo-args fuchsia-pkg://fuchsia.com/echo-args#meta/echo-args.cm这次,调试器检测到抛出了异常。使用 frame 命令检查崩溃时的堆栈轨迹:
Rust
[zxdb] frame
▶ 0 abort() • abort.c:7
  1 panic_abort::__rust_start_panic::abort() • panic_abort/src/lib.rs:43
  2 panic_abort::__rust_start_panic(…) • panic_abort/src/lib.rs:38
  3 std::panicking::rust_panic(…) • library/std/src/panicking.rs:672
  4 std::panicking::rust_panic_with_hook(…) • library/std/src/panicking.rs:642
  5 std::panicking::begin_panic::$({closure#0}<&str>)() • rust/library/std/src/panicking.rs:544
  6 std::sys_common::backtrace::$(__rust_end_short_backtrace<std::panicking::begin_panic::{closure#0}, !>)(…) • rust/library/std/src/sys_common/backtrace.rs:144
  7 std::panicking::begin_panic<…>(…) • rust/library/std/src/panicking.rs:543
  8 echo_args::main::component_entry_point::$({generator#0})(…) • main.rs:18
  9 core::future::from_generator::$({impl#1})::$(poll<echo_args::main::component_entry_point::{generator#0}>)(…) • rust/library/core/src/future/mod.rs:80
  10 core::future::future::$({impl#1})::$(poll<&mut core::future::from_generator::GenFuture<echo_args::main::component_entry_point::{generator#0}>>)(…) • future/future.rs:119
  11 futures_util::future::future::FutureExt::$(poll_unpin<core::pin::Pin<&mut core::future::from_generator::GenFuture<echo_args::main::component_entry_point::{generator#0}>>>)(…) • future/future/mod.rs:562
  12 fuchsia_async::runtime::fuchsia::executor::local::MainTask::$(poll<core::pin::Pin<&mut core::future::from_generator::GenFuture<echo_args::main::component_entry_point::{generator#0}>>>)(…) • fuchsia/src/lib/fuchsia-async/src/runtime/fuchsia/executor/local.rs:444
  13 fuchsia_async::runtime::fuchsia::executor::local::LocalExecutor::$(run_singlethreaded<core::future::from_generator::GenFuture<echo_args::main::component_entry_point::{generator#0}>>)(…) • fuchsia/src/lib/fuchsia-async/src/runtime/fuchsia/executor/local.rs:73
  14 fuchsia::$(main_singlethreaded<fuchsia::init_logging_for_component_with_executor::{closure#0}, core::future::from_generator::GenFuture<echo_args::main::component_entry_point::{generator#0}>, core::result::Result<(), anyhow::Error>>)(…) • fuchsia/src/lib/fuchsia/src/lib.rs:152
  15 echo_args::main() • main.rs:7
  16 core::ops::function::FnOnce::call_once<…>(…) • /b/s/w/ir/x/w/rust/library/core/src/ops/function.rs:227
  17 std::sys_common::backtrace::__rust_begin_short_backtrace<…>(…) • rust/library/std/src/sys_common/backtrace.rs:125
  18 std::rt::lang_start::$({closure#0}<core::result::Result<(), anyhow::Error>>)() • rust/library/std/src/rt.rs:63
  19 core::ops::function::impls::$({impl#2})::call_once<…>(…) • /b/s/w/ir/x/w/rust/library/core/src/ops/function.rs:259 (inline)
  20 std::panicking::try::do_call<…>(…) • library/std/src/panicking.rs:403 (inline)
  21 std::panicking::try<…>(…) • library/std/src/panicking.rs:367 (inline)
  22 std::panic::catch_unwind<…>(…) • library/std/src/panic.rs:129 (inline)
  23 std::rt::lang_start_internal::$({closure#2})() • library/std/src/rt.rs:45 (inline)
  24 std::panicking::try::$(do_call<std::rt::lang_start_internal::{closure#2}, isize>)(…) • library/std/src/panicking.rs:403 (inline)
  25 std::panicking::$(try<isize, std::rt::lang_start_internal::{closure#2}>)(…) • library/std/src/panicking.rs:367 (inline)
  26 std::panic::$(catch_unwind<std::rt::lang_start_internal::{closure#2}, isize>)(…) • library/std/src/panic.rs:129 (inline)
  27 std::rt::lang_start_internal(…) • library/std/src/rt.rs:45
  28 std::rt::lang_start<…>(…) • rust/library/std/src/rt.rs:62
  29 $elf(main) + 0x1f
  30 «libc startup» (-r expands)
  31 «libc startup» (-r expands)
  32 $elf(_start) + 0x11
请注意,堆栈轨迹中的第 8 行指示了 src/main.rs 中发生崩溃的位置,对应于 assert!() 宏代码行。
C++
[zxdb] frame
▶ 0 strlen(…) • strlen.c:21
  1 main(…) • main.cc:27
  2 «libc startup» (-r expands)
  3 «libc startup» (-r expands)
  4 $elf(_start) + 0x11
请注意,堆栈轨迹中的第 1 行指示了 main.cc 中发生崩溃的点,对应于 nullptr 参考。
当前堆栈帧(帧 0)位于系统库深处,但您可以通过在命令前添加堆栈轨迹中的帧编号来检查任何堆栈帧。
通过传递帧编号,在崩溃点打印实参的值,如下所示:
Rust
[zxdb] frame 8 print args
vec!["Alice", "Bob", "Spot"]
C++
[zxdb] frame 1 print arguments
{"Alice", "Bob", "Spot"}
退出调试会话以返回到终端:
[zxdb] exit
销毁实例
使用以下命令清理 echo-args 实例:
ffx component destroy /core/ffx-laboratory:echo-args