
连接到组件内的 FIDL 协议是功能路由和目录服务的组合。这意味着,诊断连接问题可能涉及多个不同的层:
- 客户端在其清单中请求协议功能。
- 提供方在其清单中公开协议功能。
- 组件拓扑将功能从提供方路由到客户端。
- 提供程序是否在正确的句柄上提供协议。
- 客户端正在尝试连接到正确的协议句柄。
在本部分中,您将探索一些 API 和工具,这些 API 和工具可帮助您查找和修复组件连接方面的问题,并监控组件的长期运行状况。
监控 FIDL 连接
借助 fidlcat 工具,您可以监控和调试 FIDL 连接,以跟踪组件发送和接收的各个 FIDL 消息。与 Fuchsia 调试器 (zxdb) 类似,fidlcat 会连接到目标设备上正在运行的 debug_agent 组件并监控正在运行的进程。
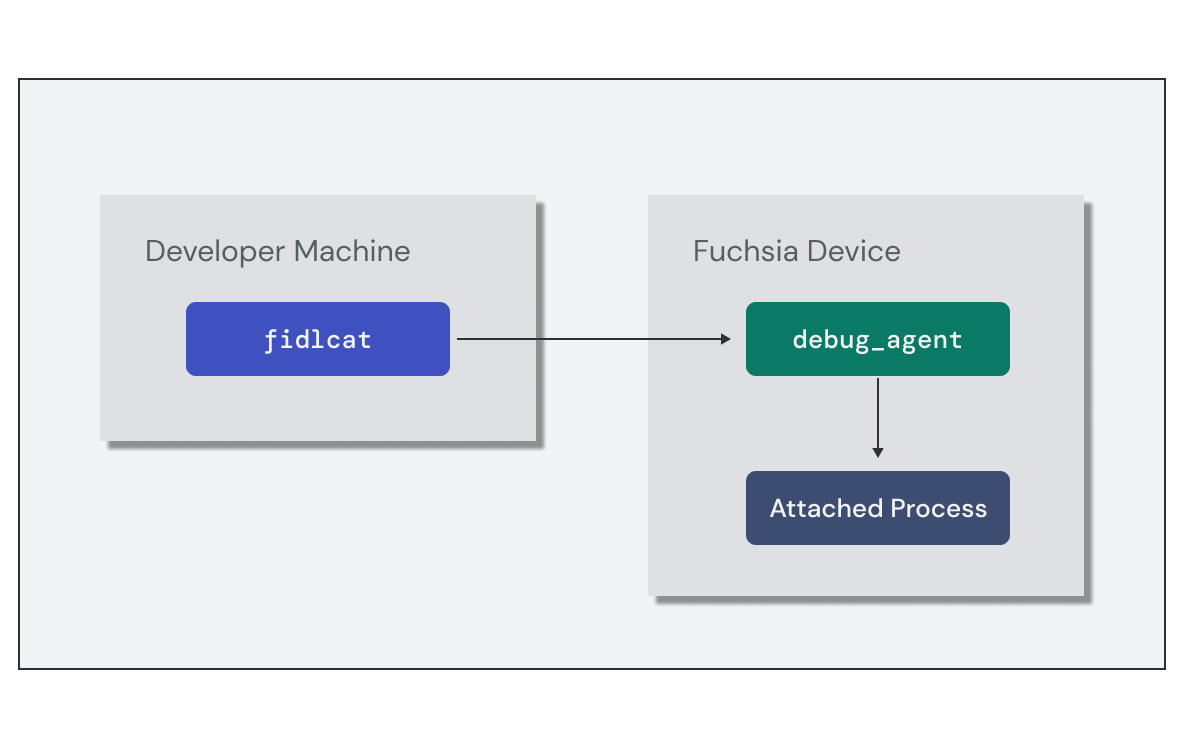
设置监控会话需要执行以下简要步骤:
- 在目标设备上运行
debug_agent组件。 - 运行
fidlcat客户端并连接到目标设备。
启动 FIDL 调试会话的最简单方法是使用 ffx debug fidl 命令,该命令会在本地 Fuchsia build 的上下文中执行所有这些操作。不过,如果您需要单独配置这些步骤,也可以手动执行。
以下是针对 FIDL 协议请求的 fidlcat 消息示例。轨迹输出包含每次翻译的实用信息,包括:
- 组件或进程名称
- 调用的系统调用
- FIDL 库、协议和方法名称
- 包含参数或返回值的消息载荷
echo-client.cm 256109:256122 zx_channel_read(handle:handle: e4c7c57f, options:uint32: 0, num_bytes:uint32: 48, num_handles:uint32: 0)
  -> ZX_OK
    received response fidl.examples.echo/Echo.EchoString = {
      response: string = "hello world!"
    }
使用“检查”
组件检查功能使 Fuchsia 组件能够使用 Inspect API 公开有关自身的结构化诊断信息。Fuchsia 通过开发者工具和 bug 报告提供此信息,以帮助诊断问题或监控性能。
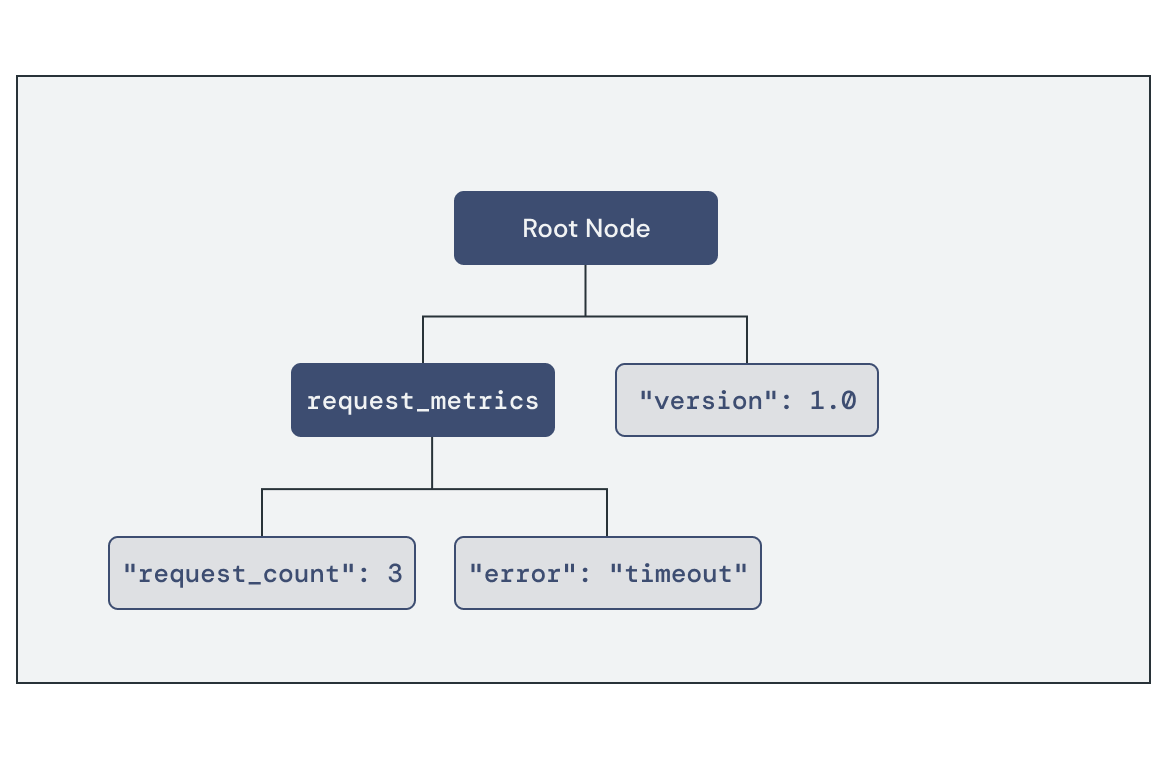
组件将检查指标公开为命名 Node 的树,每个节点都包含一组以键值对形式表示的 Properties。属性支持各种数字、字符串和数组数据类型。组件检查器库提供了一个指向组件根节点的接口,您可以在其中为应用附加其他感兴趣的属性。
您可以使用开发者工具检索当前发布到 Inspect 的指标集:
ffx inspect:让您可以使用组件选择器以交互方式查询检查状态。这有助于在开发期间调试组件。ffx target snapshot:捕获整个系统的调试快照归档,其中包含 JSON 格式的检查数据。
ffx inspect show core/foo-examplecore/foo-example:
metadata:
filename = fuchsia.inspect.Tree
component_url = fuchsia-pkg://fuchsia.com/foo-example#meta/foo-example.cm
timestamp = 55457379176
payload:
root:
version = 1.0
request_metrics:
request_count = 3
error = timeout
练习:监控提供程序组件
在本部分中,您将使用诊断工具来监控回显服务器组件的健康状况和行为。
启动模拟器
如果您尚未运行任何实例,请启动模拟器:
启动新的模拟器实例:
ffx emu start --headless启动完成后,模拟器会输出以下消息并返回:
Logging to "$HOME/.local/share/Fuchsia/ffx/emu/instances/fuchsia-emulator/emulator.log"
Waiting for Fuchsia to start (up to 60 seconds)........
Emulator is ready.
启动软件包服务器,以使模拟器能够加载软件包:
fx serve
监控 FIDL 流量
您可以使用 fidlcat 监控和调试组件中的 FIDL 连接。启动 ffx debug fidl 并将其配置为监控回显服务器组件:
ffx debug fidl --remote-name echo_server.cmChecking for debug agent on [fe80::d6c5:4526:c282:fb6%qemu]:2345.
Debug agent not found. Starting one.
INFO: [main.cc(238)] Connected to symbol server gs://fuchsia-artifacts-release/debug
INFO: [main.cc(122)] Connecting to port 2345 on fe80::d6c5:4526:c282:fb6%qemu...
INFO: [main.cc(92)] Connected!
通过启动回显客户端实例,启动与服务器的 FIDL 连接:
ffx component start /core/ffx-laboratory:echo-realm/echo_client客户端绑定到服务器组件,并使用 Echo FIDL 协议进行通信。查看 ffx debug fidl 输出,了解由 echo 服务器处理的 FIDL 交易的列表:
Monitoring echo_server.cm

echo_server.cm 58694:58696 zx_channel_read_etc(handle: handle = fb9b5273, options: uint32 = 0, num_bytes: uint32 = 512, num_handles: uint32 = 4)
  -> ZX_OK
    received request fuchsia.io/Directory.Open = { flags: uint32 = 3, mode: uint32 = 493, path: string = "svc/fidl.examples.routing.echo.Echo", object: handle = Channel:f93b597b(ZX_RIGHT_TRANSFER | ZX_RIGHT_READ | ZX_RIGHT_WRITE | ZX_RIGHT_SIGNAL | ZX_RIGHT_SIGNAL_PEER | ZX_RIGHT_WAIT | ZX_RIGHT_INSPECT)(channel:0:svc/fidl.examples.routing.echo.Echo) }

echo_server.cm 58694:58696 zx_channel_read_etc(handle: handle = Channel:f93b597b(channel:0:svc/fidl.examples.routing.echo.Echo), options: uint32 = 0, num_bytes: uint32 = 512, num_handles: uint32 = 4)
  -> ZX_OK
    received request fidl.examples.routing.echo/Echo.EchoString = { value: string = "Hello, Fuchsia" }

echo_server.cm 58694:58696 zx_channel_write_etc(handle: handle = Channel:f93b597b(channel:0:svc/fidl.examples.routing.echo.Echo), options: uint32 = 0)
  sent response fidl.examples.routing.echo/Echo.EchoString = { response: string = "Hello, Fuchsia" }
  -> ZX_OK

echo_server.cm 58694:58696 zx_channel_read_etc(handle: handle = Channel:f93b597b(channel:0:svc/fidl.examples.routing.echo.Echo), options: uint32 = 0, num_bytes: uint32 = 512, num_handles: uint32 = 4)
  -> ZX_ERR_PEER_CLOSED

echo_server.cm 58694:58696 zx_handle_close(handle: handle = Channel:f93b597b(channel:0:svc/fidl.examples.routing.echo.Echo))
  -> ZX_OK
请注意事件的顺序:
- 一个用于协议实现的渠道在
svc/fidl.examples.routing.echo.Echo处打开。 - 服务器通过开放通道接收
Echo.EchoString请求,其中包含客户端发送的字符串载荷。 - 服务器会发送包含相同字符串载荷的相应响应。
- 频道关闭。
通过跟踪组件之间的 FIDL 连接,fidlcat 可帮助您查找和诊断潜在问题,例如连接失败或数据载荷无效。
添加请求跟踪
组件检查功能可让您发布组件中的诊断信息,以协助进行调试。您将使用 Inspect API 跟踪回显服务器组件的一些使用情况统计信息。
更新 echo_server 请求处理程序,以接受包含请求数和处理的字节数的数值检查属性的新结构。处理程序会在每次收到传入请求时递增以下属性:
Rust
echo-server/src/main.rs:
// Inspect properties managed by the server
struct EchoConnectionStats {
    total_requests: fuchsia_inspect::UintProperty,
    bytes_processed: fuchsia_inspect::UintProperty,
}

// Handler for incoming service requests
async fn handle_echo_request(mut stream: EchoRequestStream, stats: &EchoConnectionStats) {
    while let Some(event) = stream.try_next().await.expect("failed to serve echo service") {
        let EchoRequest::EchoString { value, responder } = event;
        responder.send(value.as_ref().map(|s| &**s)).expect("failed to send echo response");

        if let Some(message) = value {
            // Update Inspect property values
            stats.total_requests.add(1);
            stats.bytes_processed.add(message.len() as u64);
        }
    }
}
C++
echo-server/main.cc:
struct EchoConnectionStats {
  inspect::UintProperty bytes_processed;
  inspect::UintProperty total_requests;
};

// Handler for incoming service requests
class EchoImplementation : public fidl::examples::routing::echo::Echo {
public:
  void EchoString(fidl::StringPtr value, EchoStringCallback callback) override {
    stats_->total_requests.Add(1);
    stats_->bytes_processed.Add(value->size());
    callback(std::move(value));
  }
  fidl::examples::routing::echo::Echo_EventSender* event_sender_;
  std::unique_ptr<EchoConnectionStats> stats_;
};
将以下代码添加到 main() 以初始化检查属性,并将它们传递给更新后的处理程序:
Rust
echo-server/src/main.rs:
async fn main() -> Result<(), anyhow::Error> {
    // ...

    // Component is serving and ready to handle incoming requests
    component::health().set_ok();

    // Create request tracking properties
    let root_node = component::inspector().root();
    let stats = EchoConnectionStats {
        total_requests: root_node.create_uint("total_requests", 0),
        bytes_processed: root_node.create_uint("bytes_processed", 0),
    };

    // Attach request handler for incoming requests
    service_fs
        .for_each_concurrent(None, |request: IncomingRequest| async {
            match request {
                IncomingRequest::Echo(stream) => handle_echo_request(stream, &stats).await,
            }
        })
        .await;

    Ok(())
}
C++
echo-server/main.cc:
int main(int argc, const char** argv) {
  // ...

  // Serve the Echo protocol
  EchoImplementation echo_instance;
  fidl::Binding<fidl::examples::routing::echo::Echo> binding(&echo_instance);
  echo_instance.event_sender_ = &binding.events();

  // Create request tracking properties
  inspect::Node& root_node = inspector.root();
  auto total_requests = root_node.CreateUint("total_requests", 0);
  auto bytes_processed = root_node.CreateUint("bytes_processed", 0);
  echo_instance.stats_ = std::make_unique<EchoConnectionStats>(EchoConnectionStats{
    std::move(bytes_processed),
    std::move(total_requests),
  });

  fidl::InterfaceRequestHandler<fidl::examples::routing::echo::Echo> handler =
      [&](fidl::InterfaceRequest<fidl::examples::routing::echo::Echo> request) {
        binding.Bind(std::move(request));
      };
  context->outgoing()->AddPublicService(std::move(handler));

  // ...
}
最后,更新导入以包含新的 Inspect 库:
Rust
echo-server/src/main.rs:
use anyhow::{self, Context};
use fidl_fidl_examples_routing_echo::{EchoRequest, EchoRequestStream};
use fuchsia_component::server::ServiceFs;
use fuchsia_inspect::{component, health::Reporter};
use fuchsia_inspect::NumericProperty;
use futures::prelude::*;
C++
echo-server/main.cc:
#include <fidl/examples/routing/echo/cpp/fidl.h>
#include <lib/async-loop/cpp/loop.h>
#include <lib/async-loop/default.h>
#include <lib/fidl/cpp/binding.h>
#include <lib/inspect/cpp/inspect.h>
#include <lib/sys/cpp/component_context.h>
#include <lib/inspect/component/cpp/component.h>
再次运行 fx build 以重新构建组件:
fx build验证检查数据
停止当前 echo-server 组件实例。这样,组件下次启动时就可以从软件包服务器解析最新版本。
ffx component stop /core/ffx-laboratory:echo-realm/echo_server多次运行回显客户端组件。这会导致 echo-server 中的请求计数随着每次连接而递增:
ffx component start /core/ffx-laboratory:echo-realm/echo_clientffx component start /core/ffx-laboratory:echo-realm/echo_clientffx component start /core/ffx-laboratory:echo-realm/echo_client
使用 ffx inspect 查看回显服务器组件的可用检查数据。您将在 root 节点下的树状结构中看到请求数和处理的字节数的值,以及组件健康状况:
ffx inspect show 'core/ffx-laboratory\:echo-realm/echo_server'core/ffx-laboratory\:echo-realm/echo_server:
metadata:
filename = fuchsia.inspect.Tree
component_url = #meta/echo_server.cm
timestamp = 1476246046122
payload:
root:
bytes_processed = 42
total_requests = 3
fuchsia.inspect.Health:
start_timestamp_nanos = 1467828507317
status = OK
使用 Inspect 发布健康状况和行为信息,可让您观察组件的当前状态并诊断生产设备上的问题。
销毁实例
使用以下命令清理 echo-realm 实例:
ffx component destroy /core/ffx-laboratory:echo-realm后续操作
恭喜!您已使用 FIDL 成功构建了一个 Fuchsia IPC 接口,并使用该接口将两个组件连接在一起。
您已完成本课程中的所有模块!进一步了解以下内容: