
Developing software means dealing with program crashes and uncovering the source of bugs. Fuchsia has a suite of tools to help identify and diagnose issues in your components from analyzing crash logs to full step-through debugging in core code.
Analyzing crashes
Fuchsia starts a program at boot called crashanalyzer that reports program
crashes and prints a backtrace of the crashing thread to the system log. While
you can explore these directly by reviewing the logs at runtime, the backtrace
content is encoded using the stack memory address references rather than
pointing to the corresponding lines in the program source files.
[klog][I] devmgr: crash_analyzer_listener: analyzing exception type 0x108
[klog][I] <== fatal exception: process crasher[42410] thread initial-thread[42424]
[klog][I] <== fatal page fault, PC at 0x1e1888dbbbd7
[klog][I]  CS:                   0 RIP:     0x1e1888dbbbd7 EFL:            0x10246 CR2:                  0
[klog][I]  RAX:                  0 RBX:                0x1 RCX:     0x721ad98697c6 RDX:     0x77accb36f264
[klog][I]  RSI:                  0 RDI:                  0 RBP:     0x2781c4816f90 RSP:     0x2781c4816f80
[klog][I]   R8:                  0  R9:                  0 R10:                  0 R11:              0x246
[klog][I]  R12:     0x773bf11dcda0 R13:     0x773bf11dcdd0 R14:               0x16 R15:         0x78050d69
[klog][I]  errc:               0x6
[klog][I] bottom of user stack:
[klog][I] 0x00002781c4816f80: f11dcda0 0000773b 9ccd2b38 000039b2 |....;w..8+...9..|
[klog][I] 0x00002781c4816f90: c4816fd0 00002781 88dbbba7 00001e18 |.o...'..........|
[klog][I] 0x00002781c4816fa0: 00000008 00000000 9ccd2b38 000039b2 |........8+...9..|
[klog][I] 0x00002781c4816fb0: f11dcf70 0000773b f11dcf70 0000773b |p...;w..p...;w..|
[klog][I] 0x00002781c4816fc0: cb36f570 000077ac f11dcdd0 0000773b |p.6..w......;w..|
[klog][I] 0x00002781c4816fd0: c4816ff0 00002781 cb2b0d0f 000077ac |.o...'....+..w..|
[klog][I] 0x00002781c4816fe0: 00000054 00000000 f11dcf70 0000773b |T.......p...;w..|
[klog][I] 0x00002781c4816ff0: f11dcfe0 0000773b 00000000 00000000 |....;w..........|
[klog][I] arch: x86_64
[klog][I] dso: id=a94c78564173530d51670b6586b1aa471e004f06 base=0x7d3506a49000 name=libfdio.so
[klog][I] dso: id=a61961ba9776a67a00fb322af9ebbdcfd1ce3f62 base=0x77accb297000 name=libc.so
[klog][I] dso: id=760f1e6e47d3dd8b6a19150aa47241279ec75a9c base=0x721ad9863000 name=<vDSO>
[klog][I] dso: id=b18462140c6784a53736105bbf3021852eeda68c base=0x1e1888dbb000 name=app:crasher
[klog][I] bt#01: pc 0x1e1888dbbbd7 sp 0x2781c4816f80 (app:crasher,0xbd7)
[klog][I] bt#02: pc 0x1e1888dbbba7 sp 0x2781c4816fa0 (app:crasher,0xba7)
[klog][I] bt#03: pc 0x77accb2b0d0f sp 0x2781c4816fe0 (libc.so,0x19d0f)
[klog][I] bt#04: pc 0 sp 0x2781c4817000
[klog][I] bt#05: end
This is because the debug symbols are stripped out of the core binaries
by default at build time. To properly analyze the crash log, you need to
reapply those symbols to the backtrace to see the call stack in terms of source
code line numbers. When you call the ffx log command, the developer tools
process the raw log through an additional binary called symbolizer that
reapplies the symbols from your local build configuration to any backtraces in
the log.
ffx logThe output you see includes the symbols reapplied to the backtrace:
[klog][I] devmgr: crash_analyzer_listener: analyzing exception type 0x108
... same output as "raw" backtrace ...
start of symbolized stack:
[klog][I] #01: blind_write at ../../src/developer/forensics/crasher/cpp/crasher.c:21
[klog][I] #02: main at ../../src/developer/forensics/crasher/cpp/crasher.c:137
[klog][I] #03: start_main at ../../zircon/third_party/ulib/musl/src/env/__libc_start_main.c:49
[klog][I] #04: unknown, can't find pc, sp or app/library in line
end of symbolized stack
With a properly symbolized backtrace, you can directly discover the site of a crash in your source code.
Step-through debugging
Just knowing where a program crashed may not be enough information to fully
diagnose the issue. Sometimes it's necessary to walk through the code
step-by-step and even inspect the state of variables in memory. To support this,
Fuchsia has a debugger for core code called zxdb.
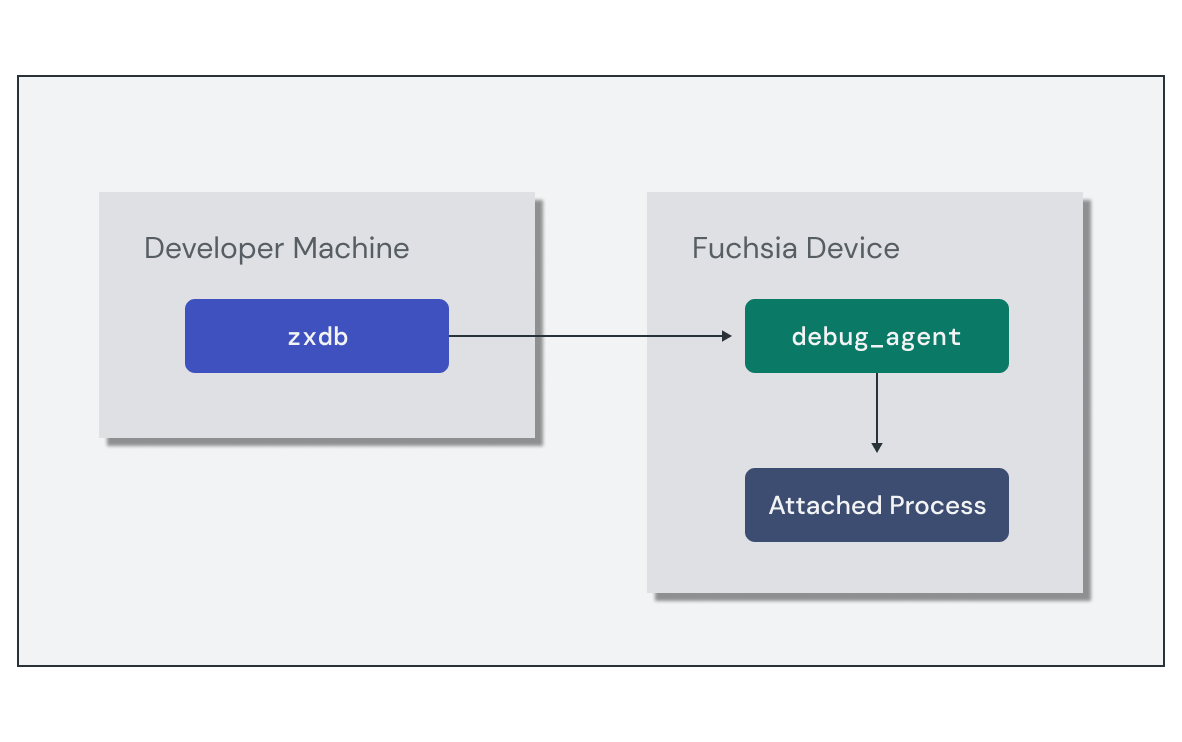
The zxdb tool is a client that connects to a running debug_agent component
on the target device. You can use the zxdb commands to configure the
debug_agent to attach to specific processes and set breakpoints. Once a debug
session is attached to a running process, zxdb allows you to step through the
code and inspect the stack frames.
Setting up the debug session requires the following high-level steps:
- Run the
debug_agentcomponent on the target device. - Run the
zxdbclient and connect to the target device. - Set the location for
zxdbto find debug symbols.
The simplest method to start a debug session is to use the ffx debug connect
command, which does all of these in the context of your local Fuchsia build.
However, these steps can also be performed manually if you need to configure
them separately.
Once the debug session is active, you are taken to a [zxdb] prompt to issue
debugger commands. You can use zxdb to configure the debug_agent to attach
to a process using a name filter and set pending breakpoints even if no
matching process is currently running.
The following example sets a pending breakpoint on main to stop at the beginning of execution, and waits for a process called "hello-world" to start:
[zxdb] attach hello-world
Waiting for process matching "hello-world"

[zxdb] break main
Breakpoint 1 (Software) on Global, Enabled, stop=All, @ main
Pending: No matches for location, it will be pending library loads.
Once the debugger is attached to a process, you can use zxdb commands to
control and inspect the state of the process. Here is a short collection of
common commands:
step
|
Step over the next line of code in the thread |
next
|
Step into the next line of code in the thread |
continue
|
Continue execution until the next breakpoint, exception, or exit |
frame
|
List or select from the current stack frames |
print
|
Evaluate an expression and print the result |
Exercise: Using the Fuchsia debugger
In this exercise, you'll use the Fuchsia debugger (zxdb) to inspect a running
instance of the echo component and understand the cause of a crash.
Start the emulator
If you do not already have an instance running, start FEMU with networking support:
ffx emu start workstation_eng.x64 --headlessStart a debug session
Once the emulator has started up, start a zxdb debugging session with the
ffx debug connect command:
ffx debug connectConnecting (use "disconnect" to cancel)...
Connected successfully.
👉 To get started, try "status" or "help".
[zxdb]
After successfully connecting, the zxdb prompt is ready to accept commands.
Attach to the component
Before launching the component, configure zxdb to attach to an instance of
echo. This enables the debugger to attach as soon as the process starts:
[zxdb] attach echo
Set a breakpoint on the greeting() function:
[zxdb] break greeting
With the debugger ready, start a new echo component instance:
ffx component run /core/ffx-laboratory:echo fuchsia-pkg://fuchsiasamples.com/echo-example#meta/echo.cmExplore the debug session
Upon reaching the breakpoint in greeting(), execution stops and the debugger
waits for a new command. Use the list command to show where execution is
currently paused:
[zxdb] list
  17
  18 // Return a proper greeting for the list
▶ 19 std::string greeting(std::vector<std::string>& names) {
  20   // Join the list of names based on length
  21   auto number_of_names = names.size();
  22   switch (number_of_names) {
  23     case 0:
  24       return "Nobody!";
  25     case 1:
  26       return join(names, "");
  27     case 2:
  28       return join(names, " and ");
  29     default:
Step into the greeting() function using the next command:
[zxdb] next
The print command will output the state of any variables in the current stack
frame. Print the current value of names:
[zxdb] print names
{"Alice", "Bob", "Spot"}
Step through the greeting() function a more few times using next:
[zxdb] next
To let the program continue to completion, use the continue command:
[zxdb] continue
Exit the debugging session to return to the terminal:
[zxdb] exit
Introduce some crashing code
Next, you'll add some code to main() to cause the component to crash
(or panic). Simulate this behavior by adding an strlen(nullptr) reference just
after the arguments are collected:
echo/main.cc:
int main(int argc, const char* argv[], char* envp[]) {
  // ...

  // Simulate a crash
  std::strlen(nullptr);

  // Print a greeting to syslog
  std::cout << "Hello, " << echo::greeting(arguments) << "!" << std::endl;

  return 0;
}
Build and publish the updated package to the fuchsiasamples.com repository:
bazel run //fuchsia-codelab/echo:pkg.publish -- \
    --repo_name fuchsiasamples.com
Start a new debug session with zxdb:
ffx debug connectDebug the crashing stack frame
Configure the debugger to attach to the echo component:
[zxdb] attach echo
Start a new instance of the component:
ffx component run /core/ffx-laboratory:echo fuchsia-pkg://fuchsiasamples.com/echo-example#meta/echo.cm --recreateThis time, the debugger detects that an exception was thrown and halts execution:
Attached Process 1 state=Running koid=1164808 name=echo.cm
════════════════════════════════════════════════
 Page fault reading address 0x0 (second chance)
════════════════════════════════════════════════
 Process 1 (koid=1164808) thread 1 (koid=1164810)
 Faulting instruction: 0x43e0fd349210

🛑 strlen(const char*) • strlen.c:21
[zxdb]
Use the frame command to inspect the stack trace at the point of the crash:
[zxdb] frame
▶ 0 strlen(…) • strlen.c:21
  1 main(…) • main.cc:27
  2 «libc startup» (-r expands)
  3 «libc startup» (-r expands)
  4 $elf(_start) + 0x11
Notice line 1 in the stack trace indicates the point in main.cc where the
crash happened, corresponding to the nullptr reference.
The current stack frame (frame 0) is deep within the system library, but you can inspect any stack frame by prefixing the command with the frame number from the stack trace.
Print the value of the arguments at the point of the crash by passing the frame number as follows:
[zxdb] frame 1 print arguments
{"Alice", "Bob", "Spot"}
Exit the debugging session to return to the terminal:
[zxdb] exit
Destroy the instance
Clean up the echo instance using the following command:
ffx component destroy /core/ffx-laboratory:echo