Overview
Chromeperf is a system for monitoring and visualizing benchmark results. It is maintained by the Chrome team. This guide describes how to find and use the results of your benchmarks in Chromeperf.
Chromeperf is sometimes referred to as the "Catapult performance dashboard" in the Fuchsia codebase, or just "Catapult" for short, because its code lives in the Catapult project Git repo.
Accessing the dashboard
The dashboard can be found at https://chromeperf.appspot.com/report.
Note that Fuchsia data is currently only available to Googlers. You will need to sign in with a google.com account for the Fuchsia performance results to be visible in Chromeperf. Click Sign in in the top right corner to do that.
Searching and adding graphs
The dashboard displays a list of search boxes. The placeholder names are relics from the days when Chrome infrastructure was still using BuildBot. Since they are not relevant to Fuchsia infrastructure, Fuchsia data is mapped to these fields with the following scheme:
Test suite== the name of the benchmark suite.Bot== A Fuchsia LUCI builder that has run the benchmark at least once.Subtest== The name of the test case in your benchmark suite.
Type the name of your benchmark suite in the first box to begin searching. For example, if there is a benchmark suite named "zircon_benchmarks", it will get displayed with autocomplete if you type "zircon".

Select a builder and a subtest. Note that if your subtest is named "foo", there will be
multiple "foo_
When you're finished filling out each field, click Add to add your graph to the UI. You should see something like this:

Viewing sample metadata
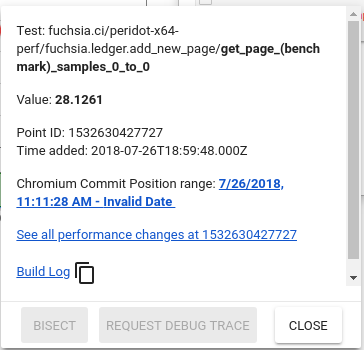
If you hover over a point in a graph, you can see some extra information such as the point's value, the date it was recorded, and a link to the log page of the build that generated it.

Saving the view
Chromeperf's web UI does not have a built-in mechanism for saving a collection of graphs. If you want to save a list of graphs so that you can share with others or re-open the list later, you can copy the URL from the Chrome Address Bar.
Beware, you will have to re-copy the URL each time you add, modify or remove a graph. This includes moving the green slider beneath a graph or making any selections in the box to the right of the graph.
