This extension adds support for working with Fuchsia targets and source code.
Compatibility
The Fuchsia extension is compatible with ffx 2025-08-12T20:40:15+00:00 and forward.
Edit code
By default, VS code provides syntax highlighting, errors and warnings, jumping to a definition, and lists references for C++.
VS Code actively analyzes your code in the background and can show you various warnings or errors. For more information, see Errors and warnings.
The Fuchsia extension also provides syntax highlighting for FIDL and CML.
Core features
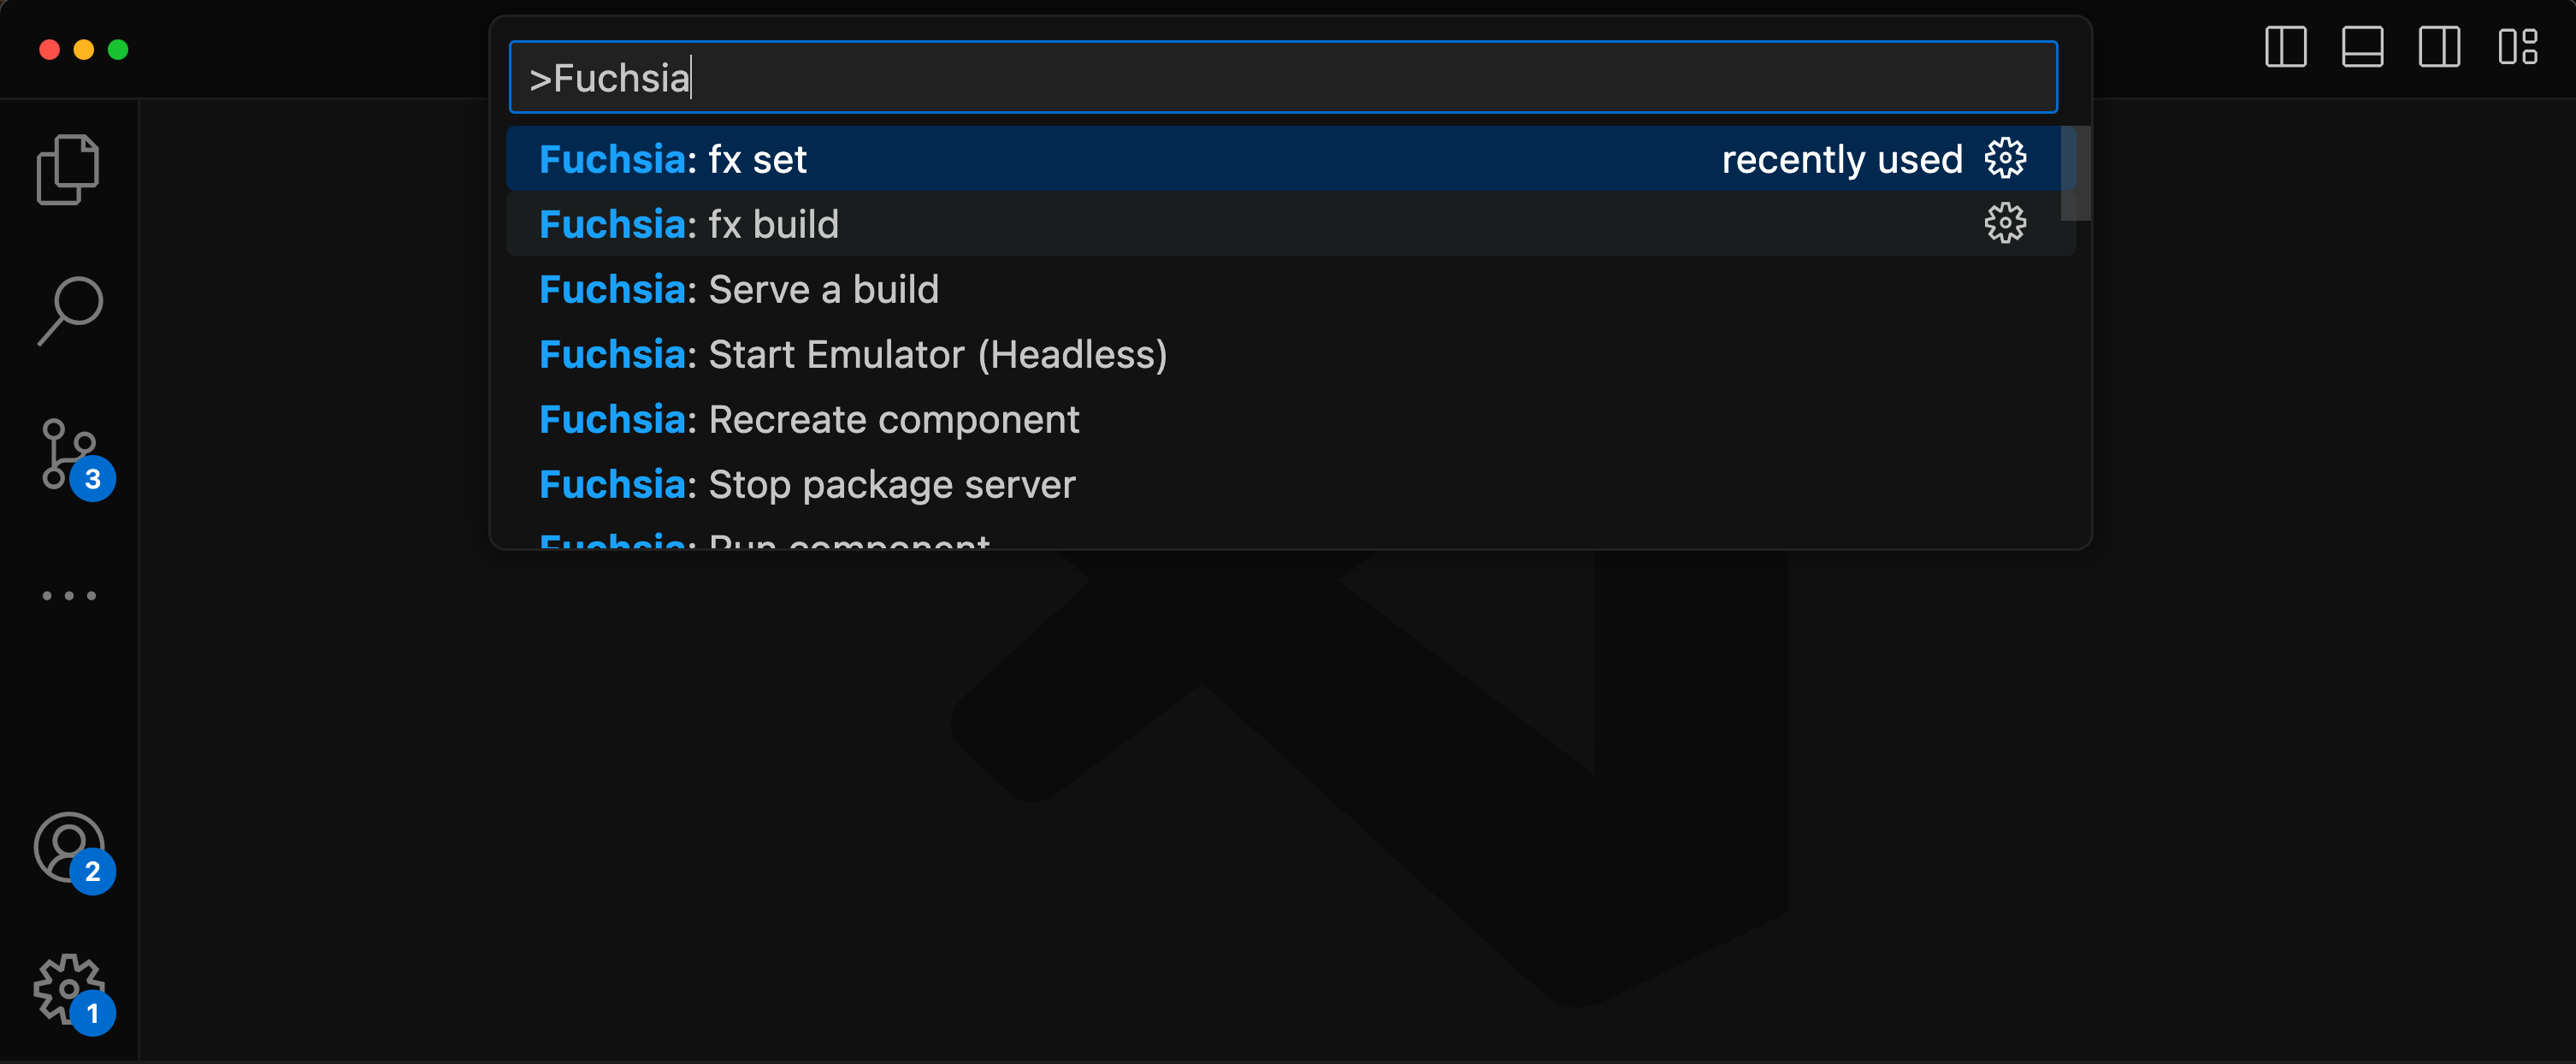
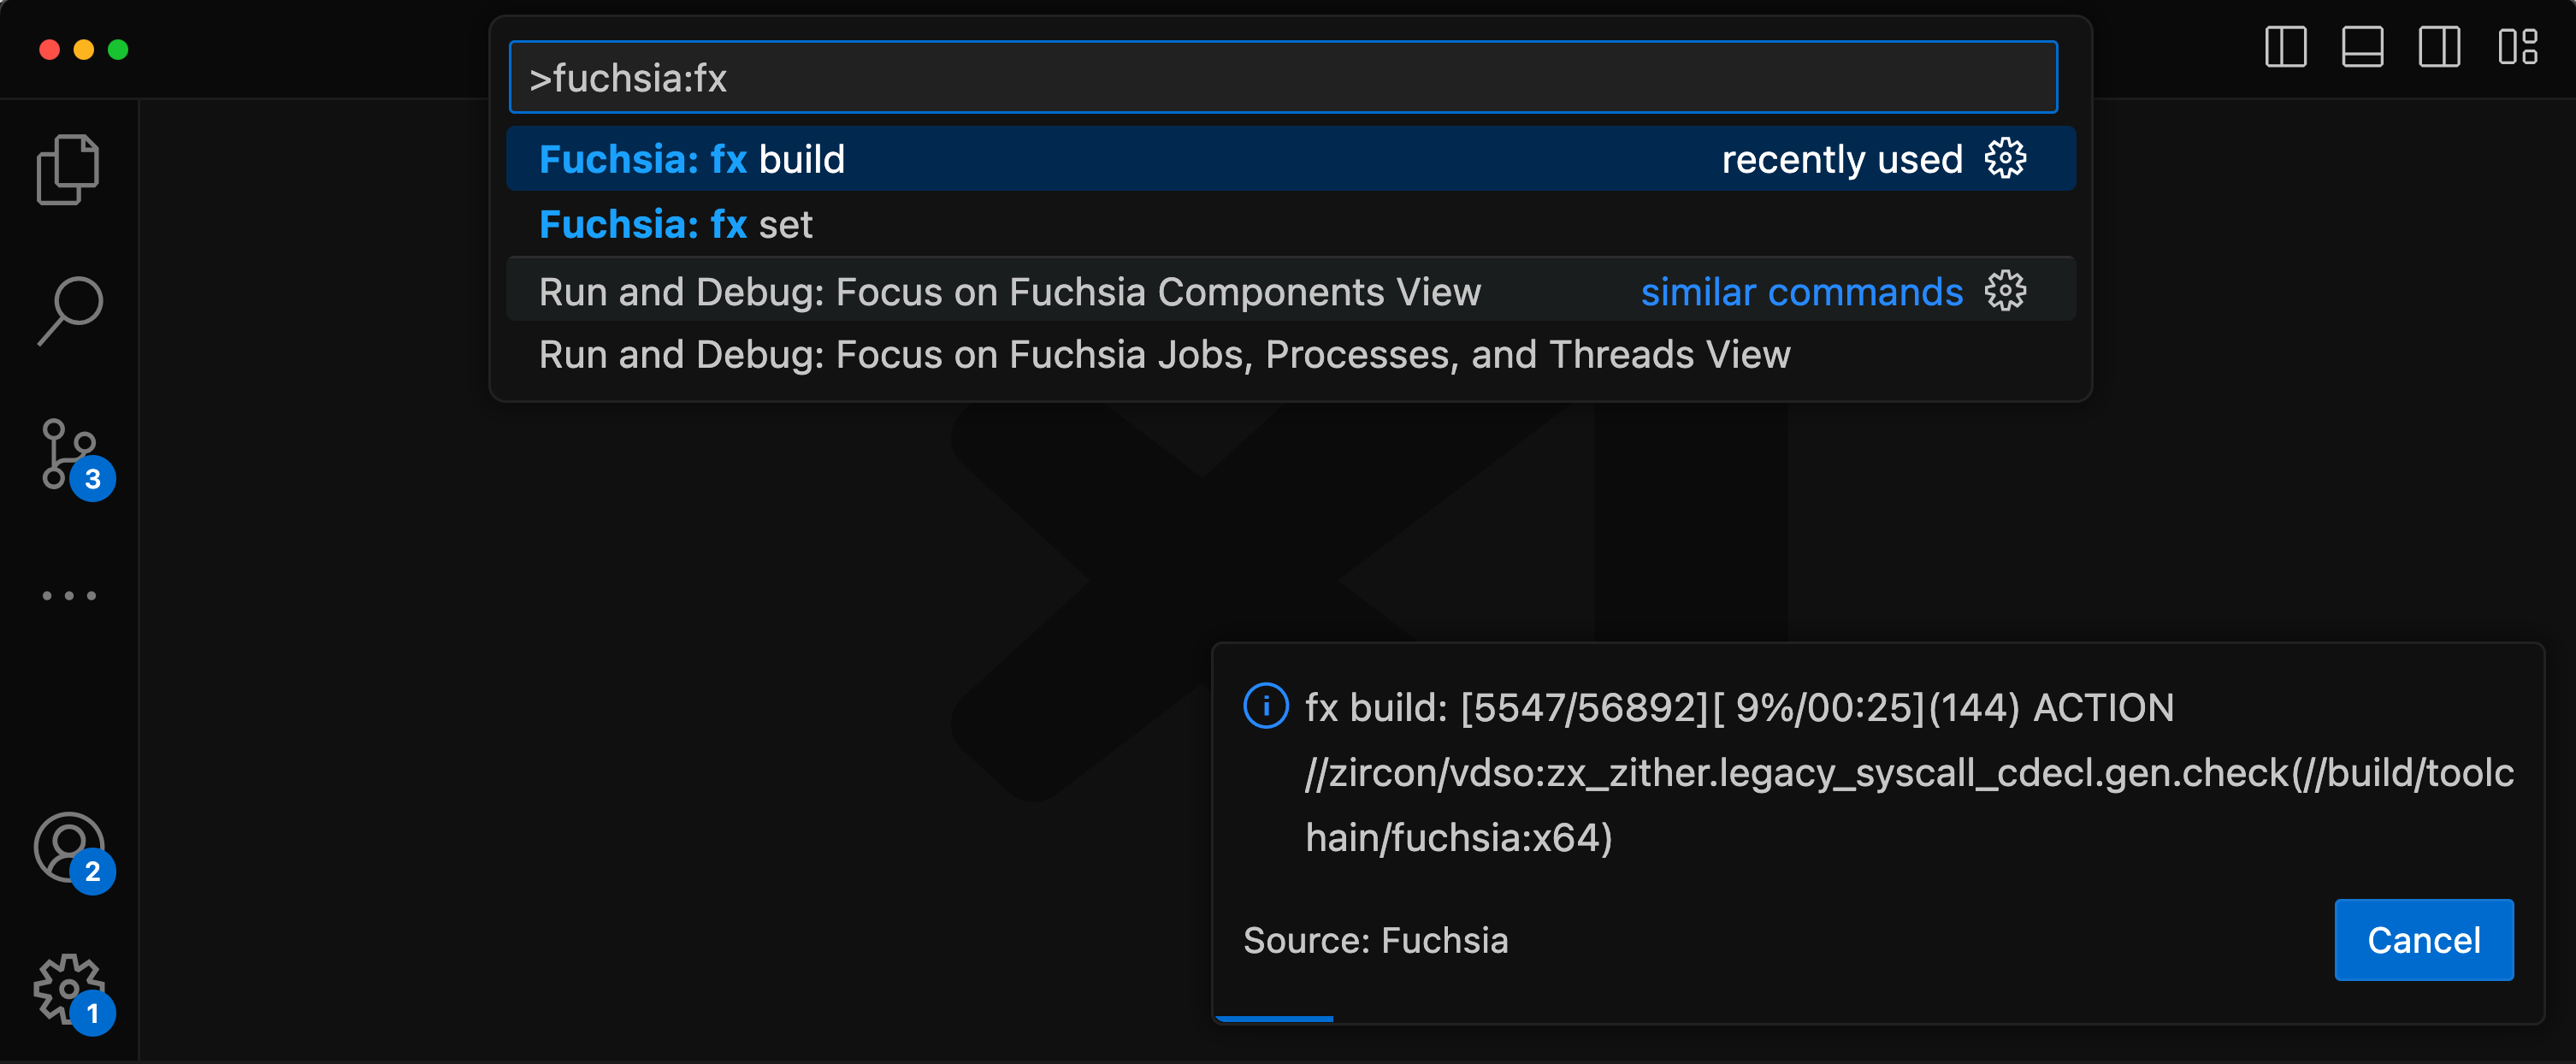
All features are accessible via the VS Code command palette Ctrl+Shift+P
(Linux/Windows) or Cmd+Shift+P(Mac). Type "Fuchsia" in the command palette to
see a list of available commands.
Building Fuchsia
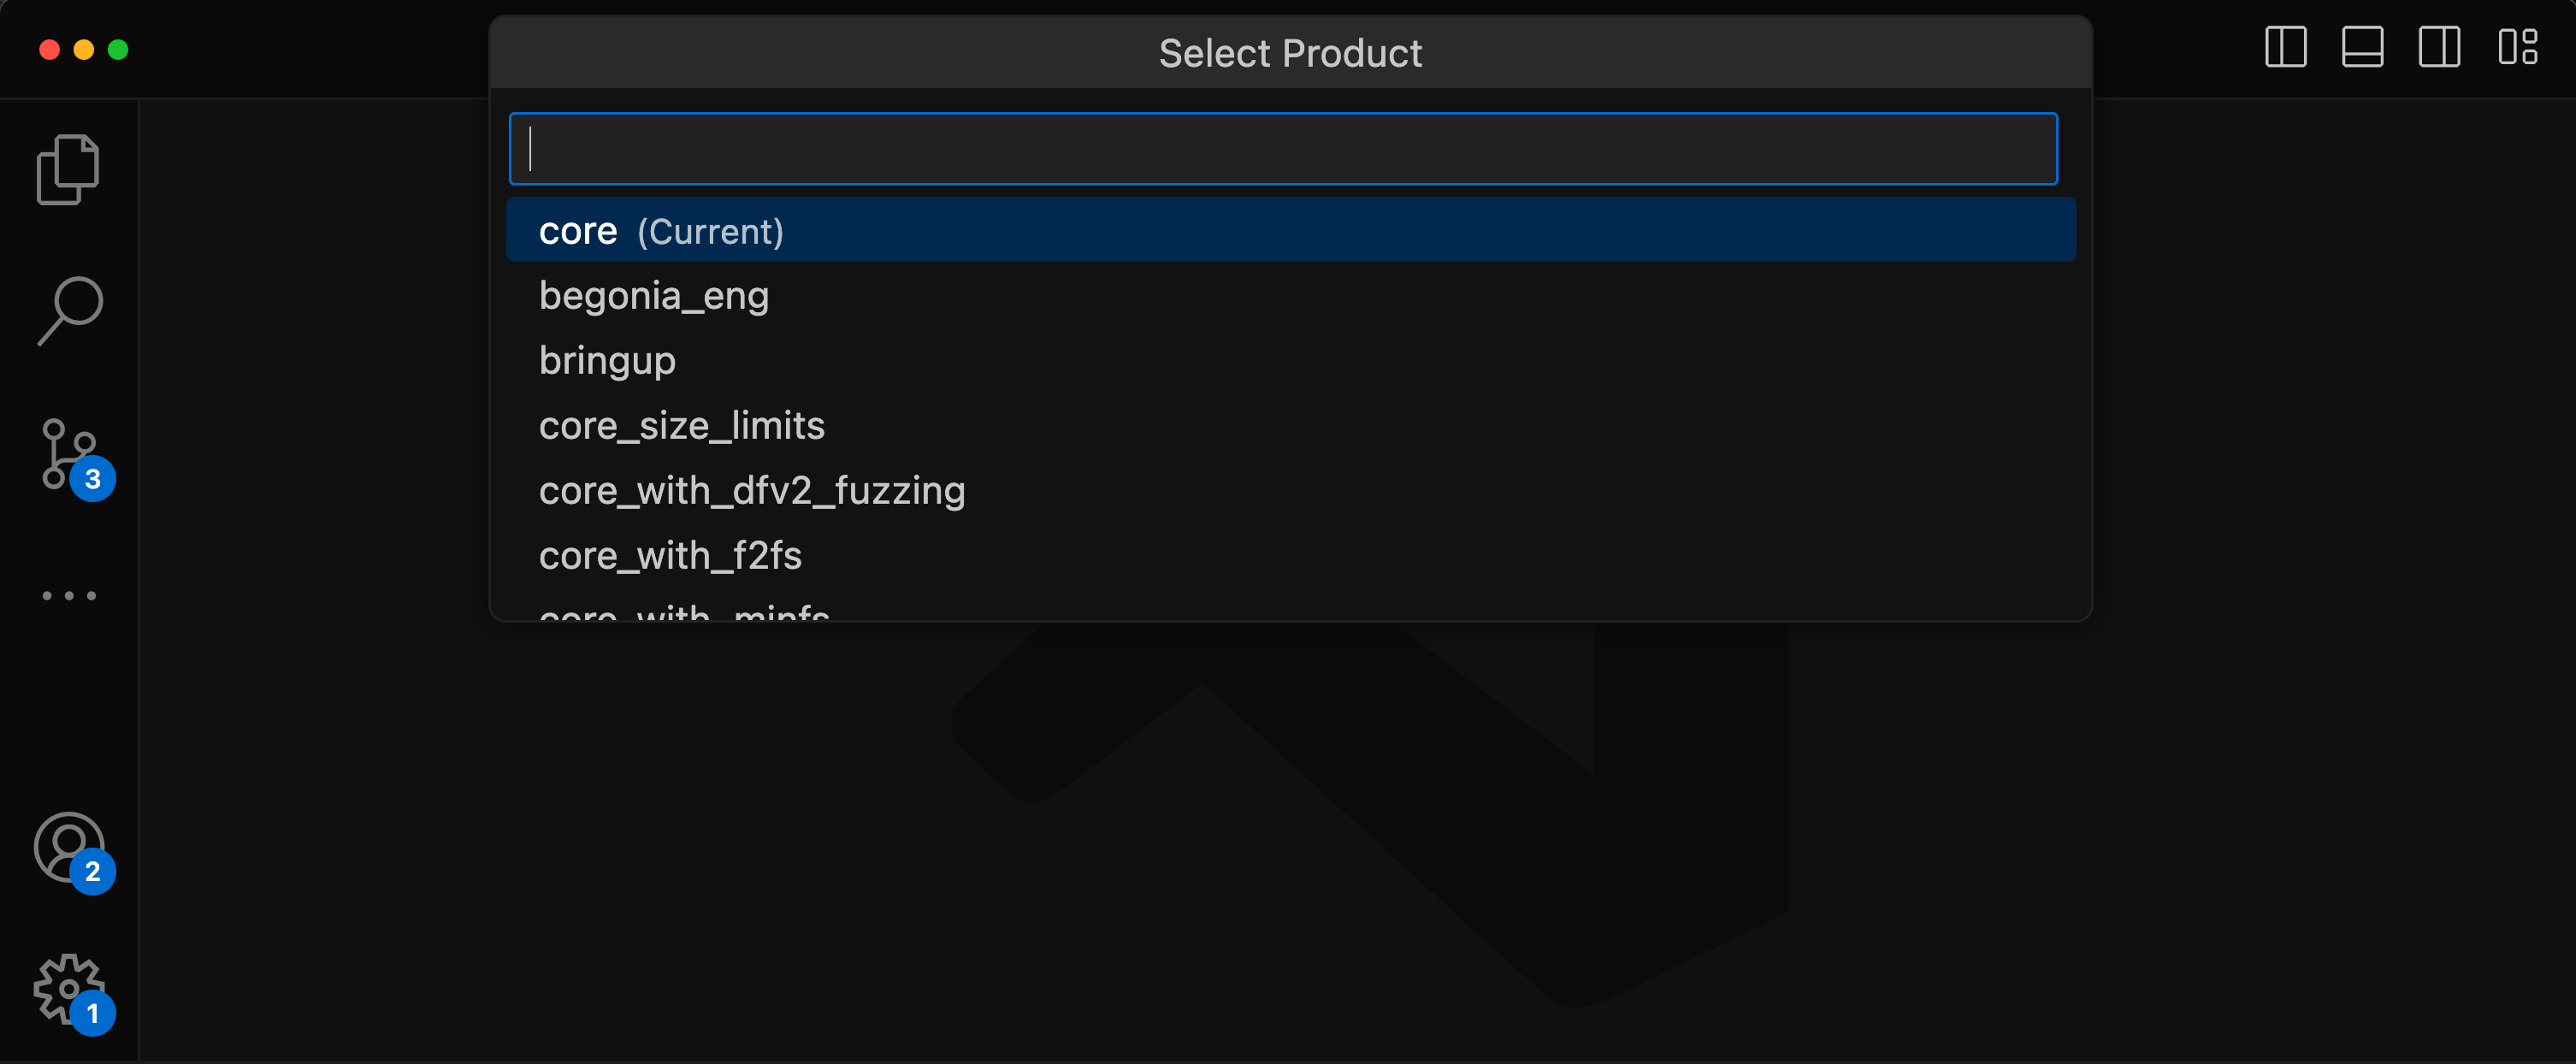
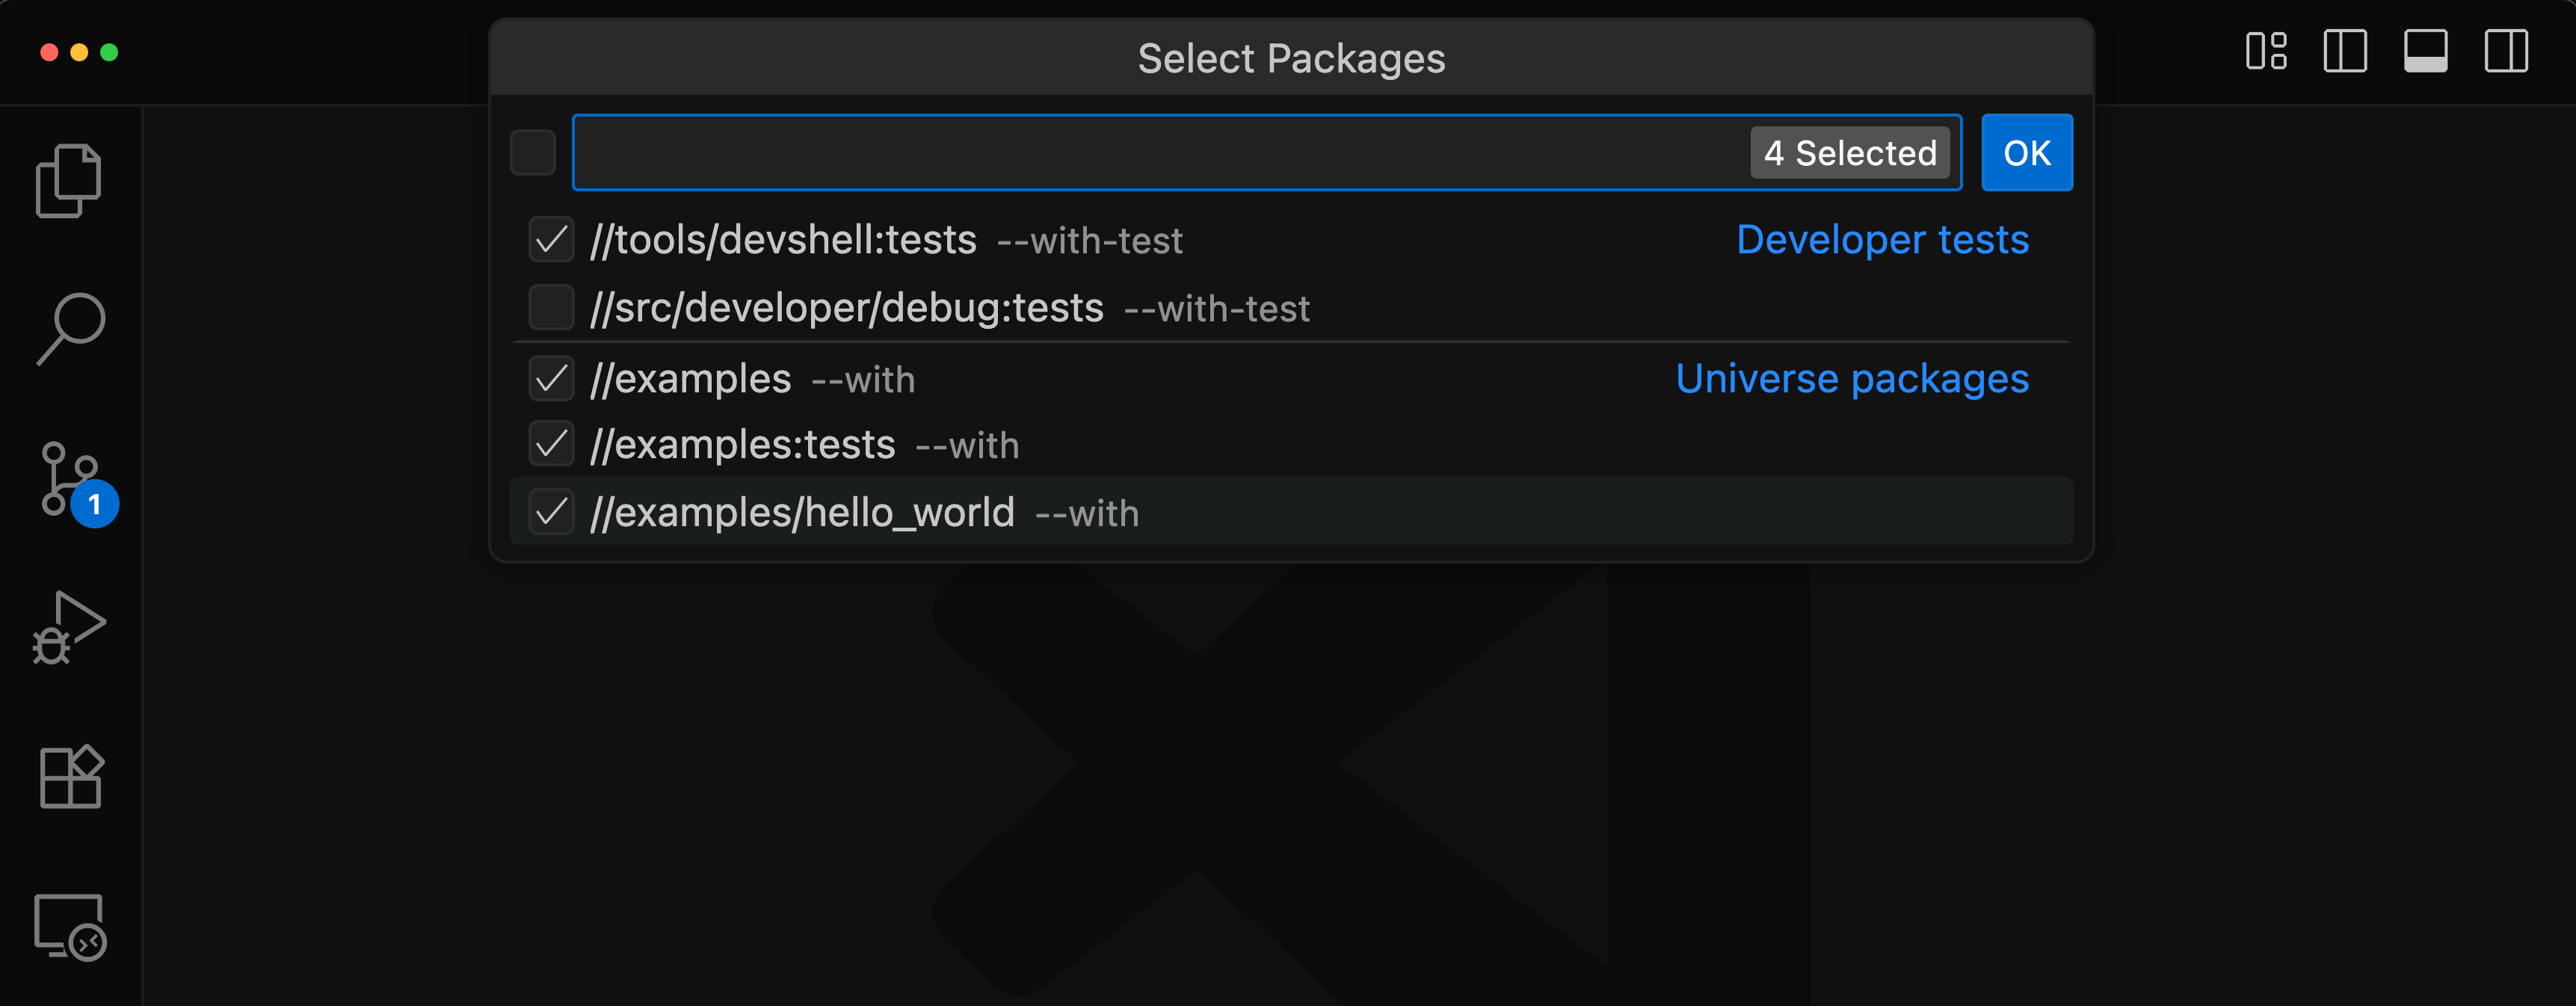
fx set
This feature allows you to interactively select product, board, compilation mode, and packages for your Fuchsia build.
The current build configuration shows at the top of the list.
Packages show a history of selections made within the session.
fx build
Run Fuchsia builds within VS Code. The extension displays current build progress
and you can see more details in Output > Fuchsia Extension.
File paths in the build output errors are clickable, allowing you to jump directly to the error in the source code.
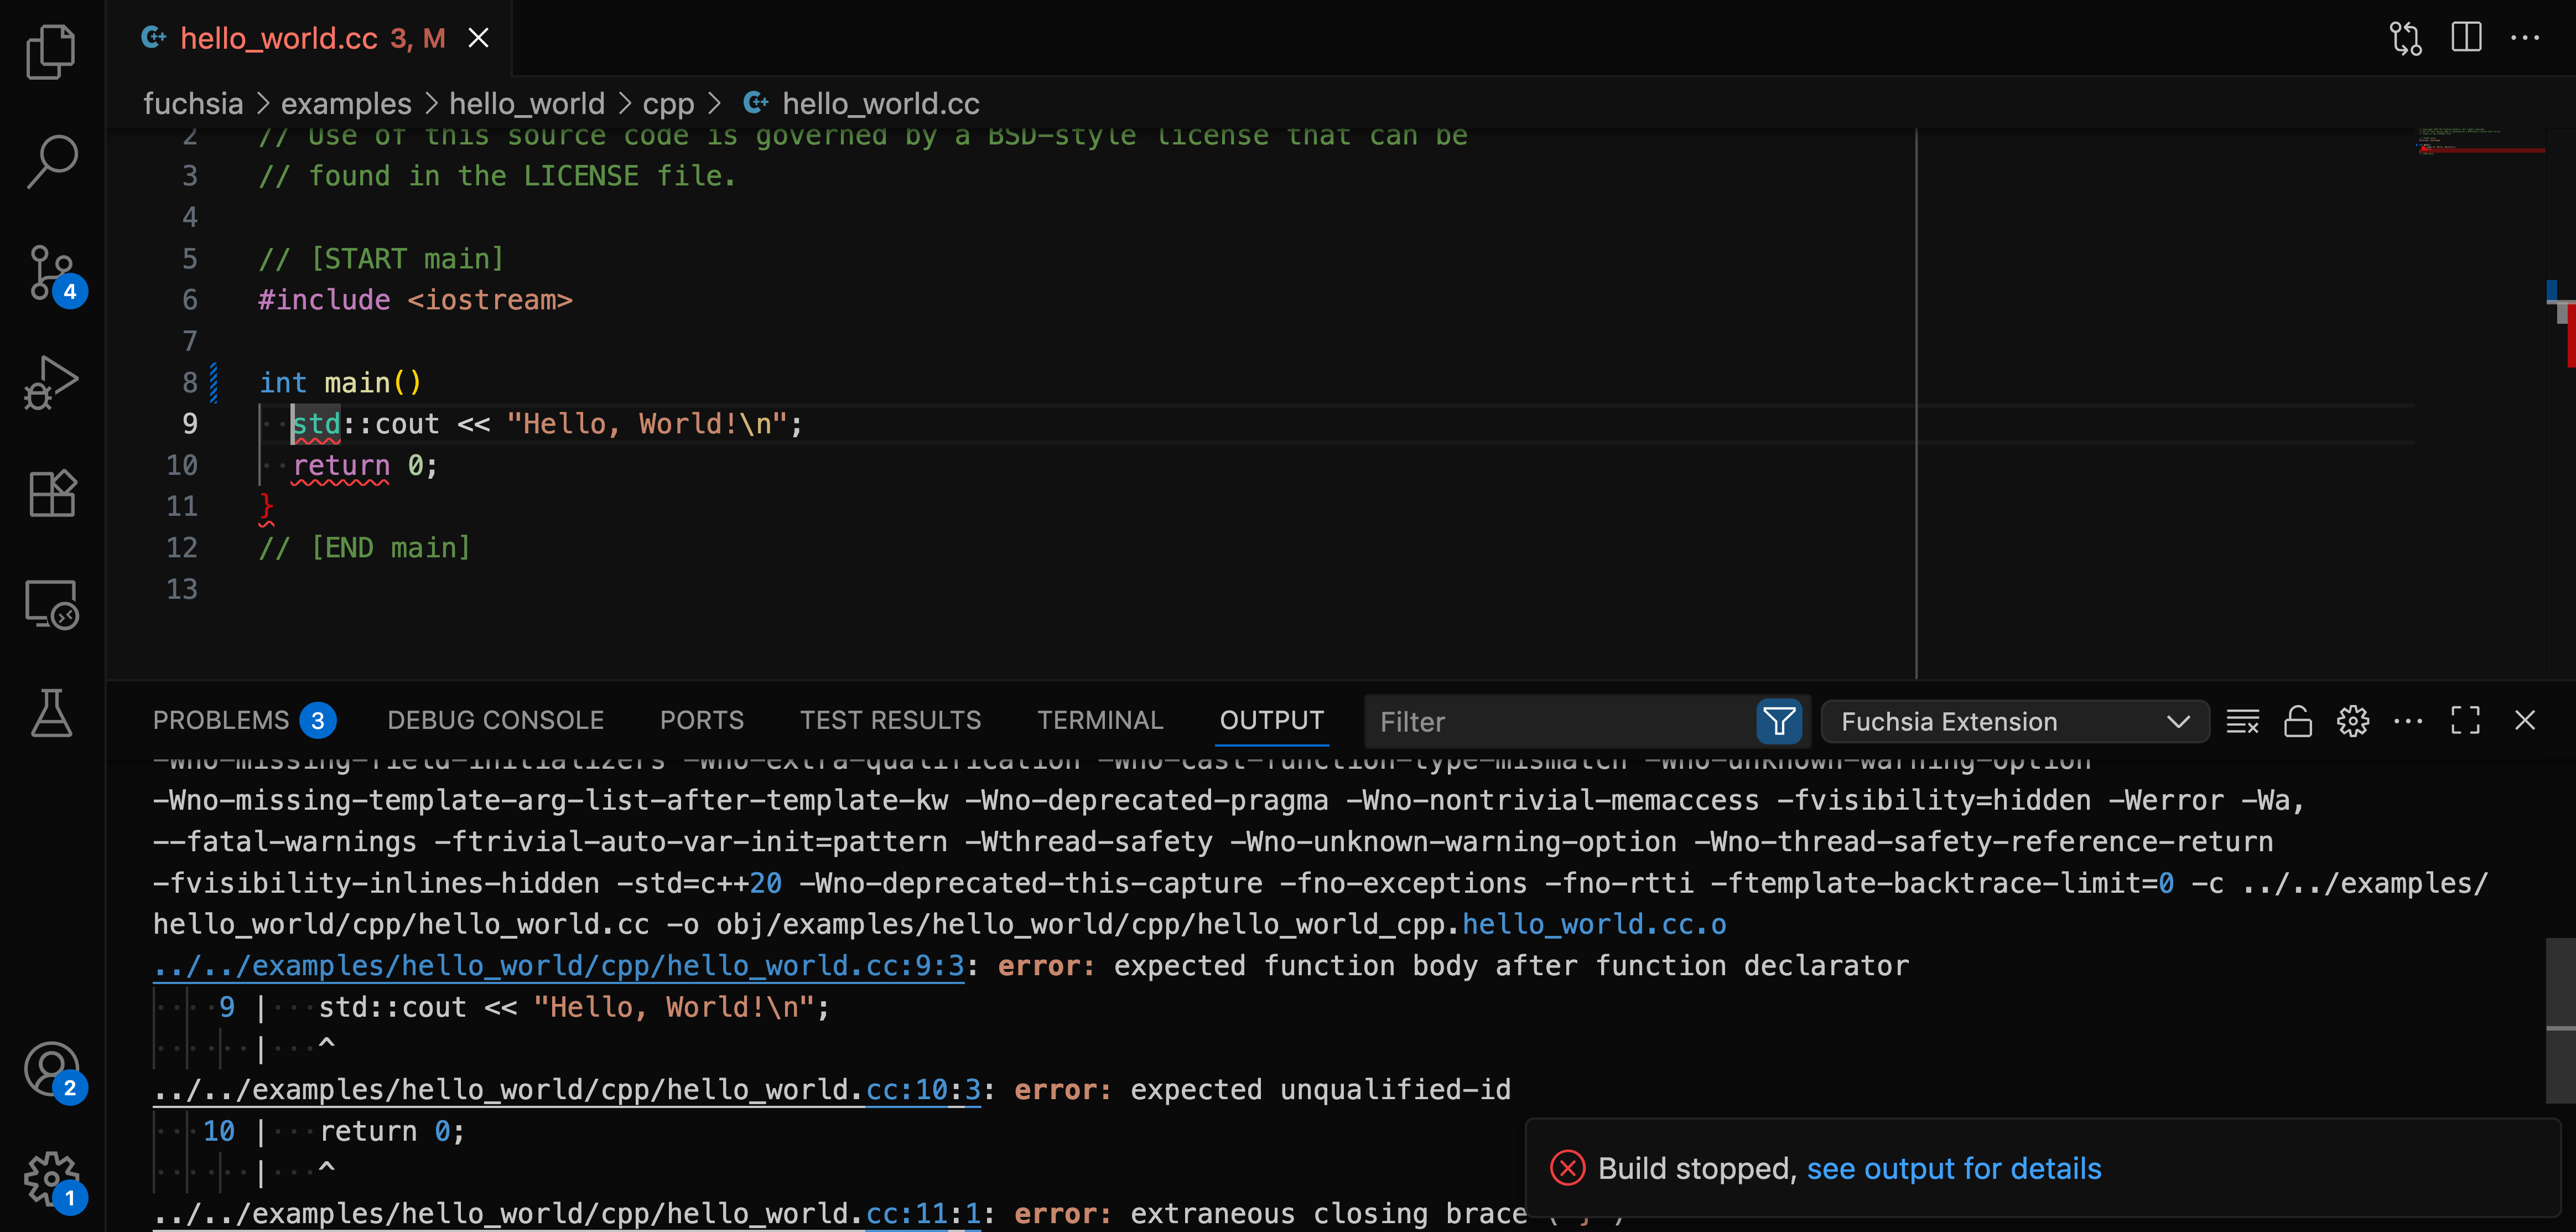
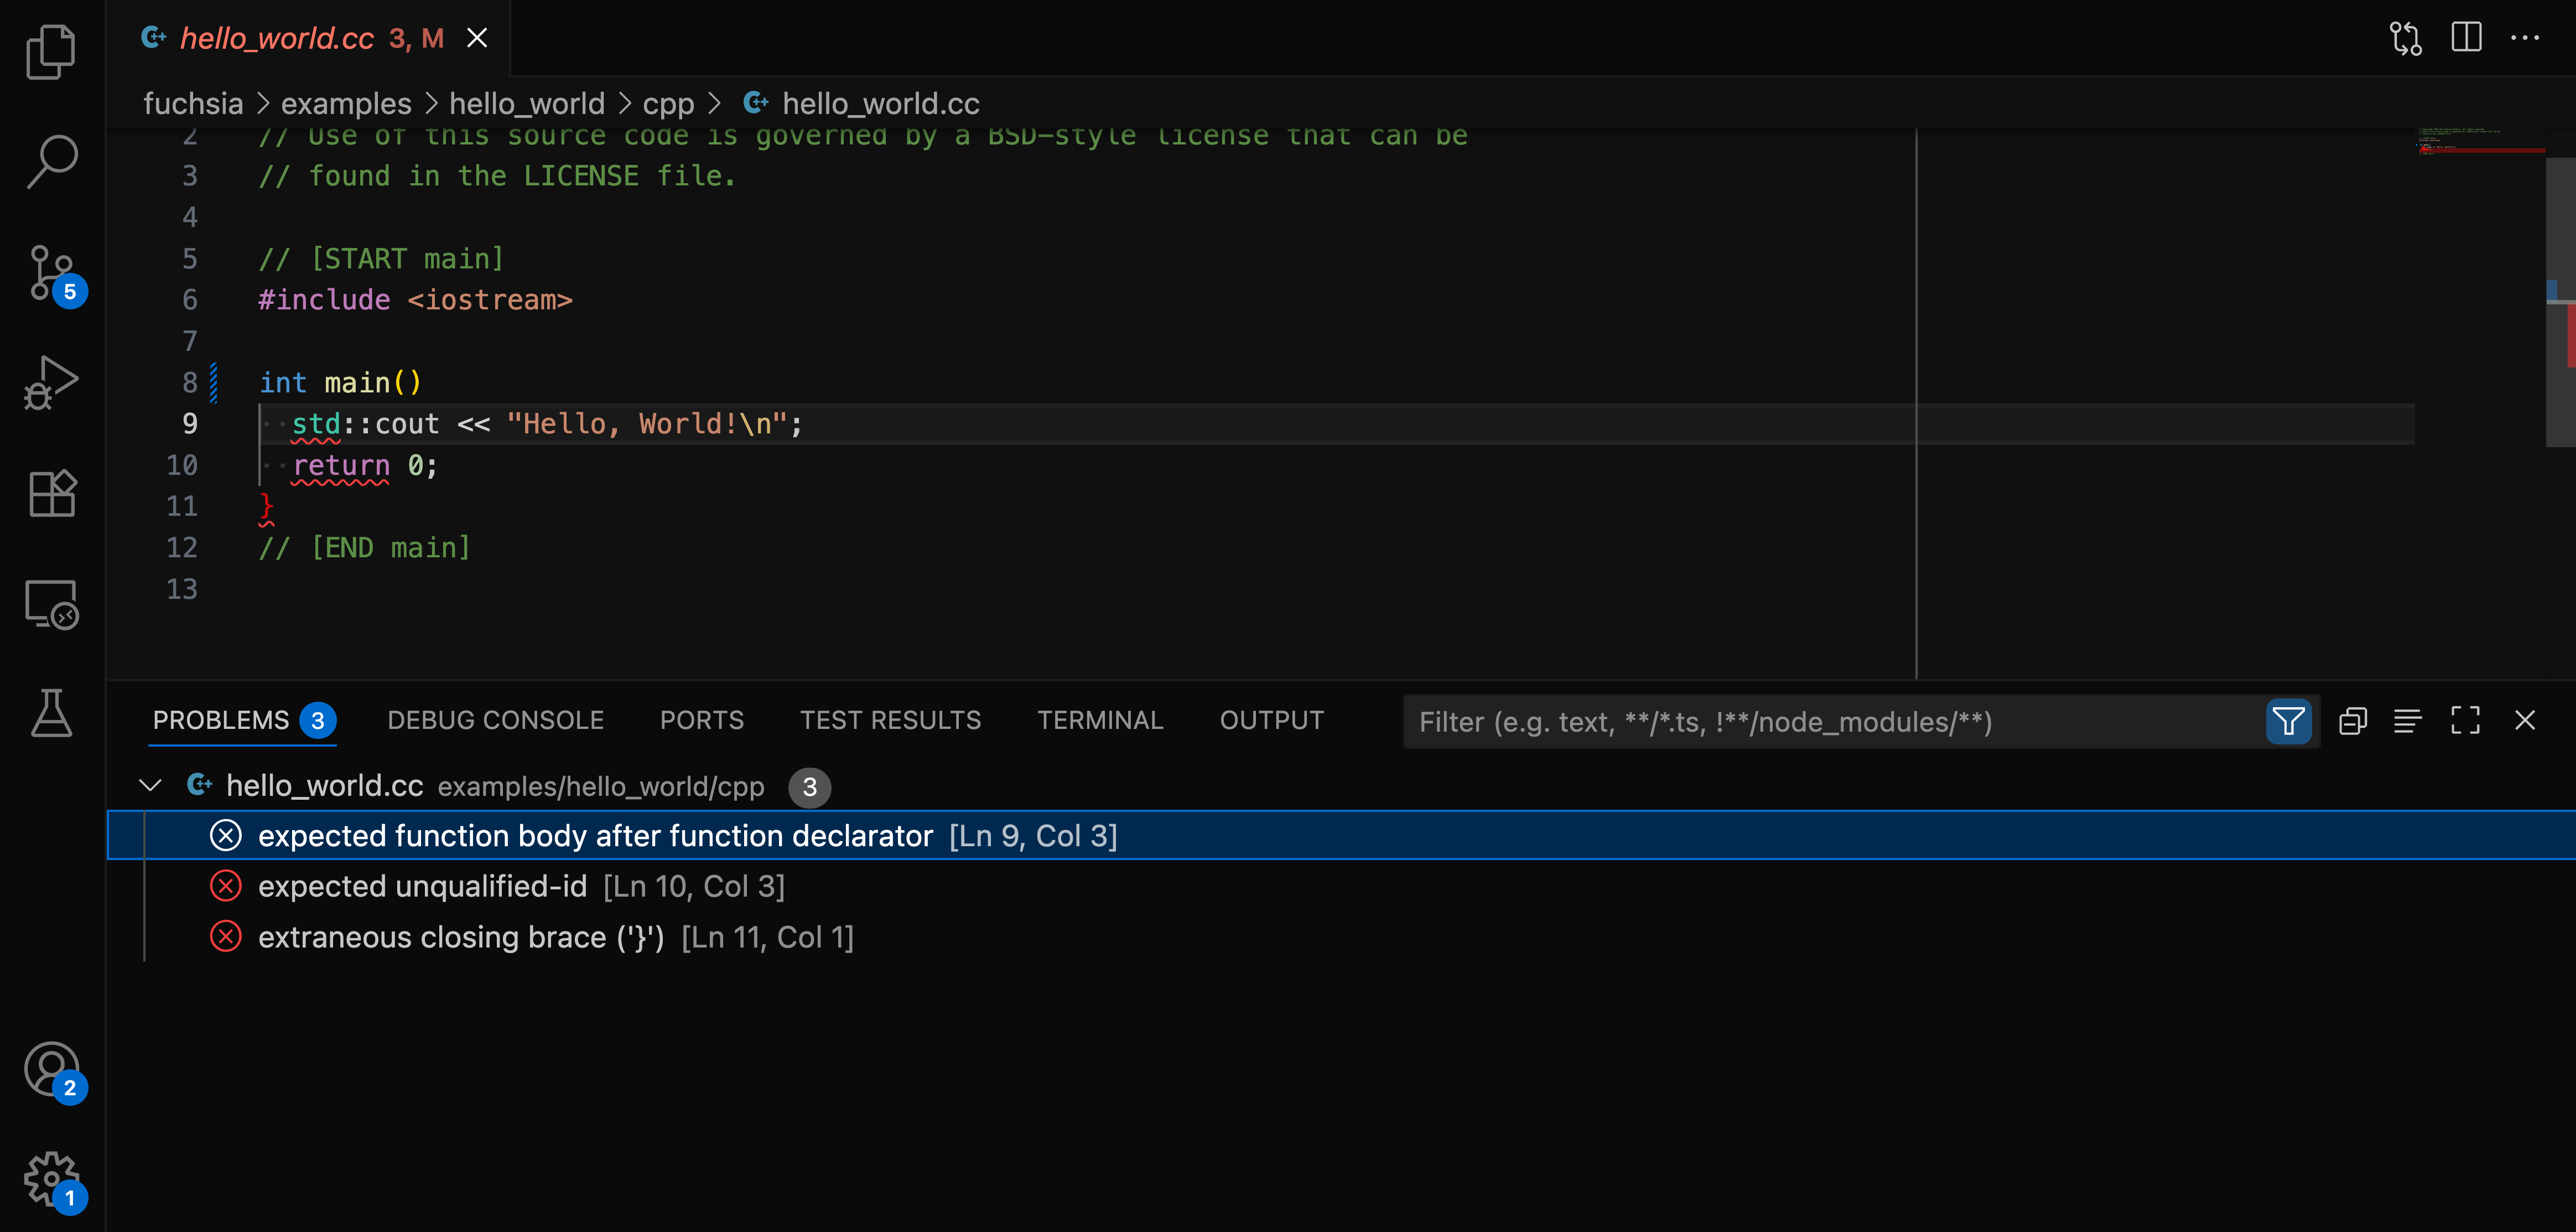
The extension parses build output to show C++ and Rust errors in the "Problems" panel of VS Code.
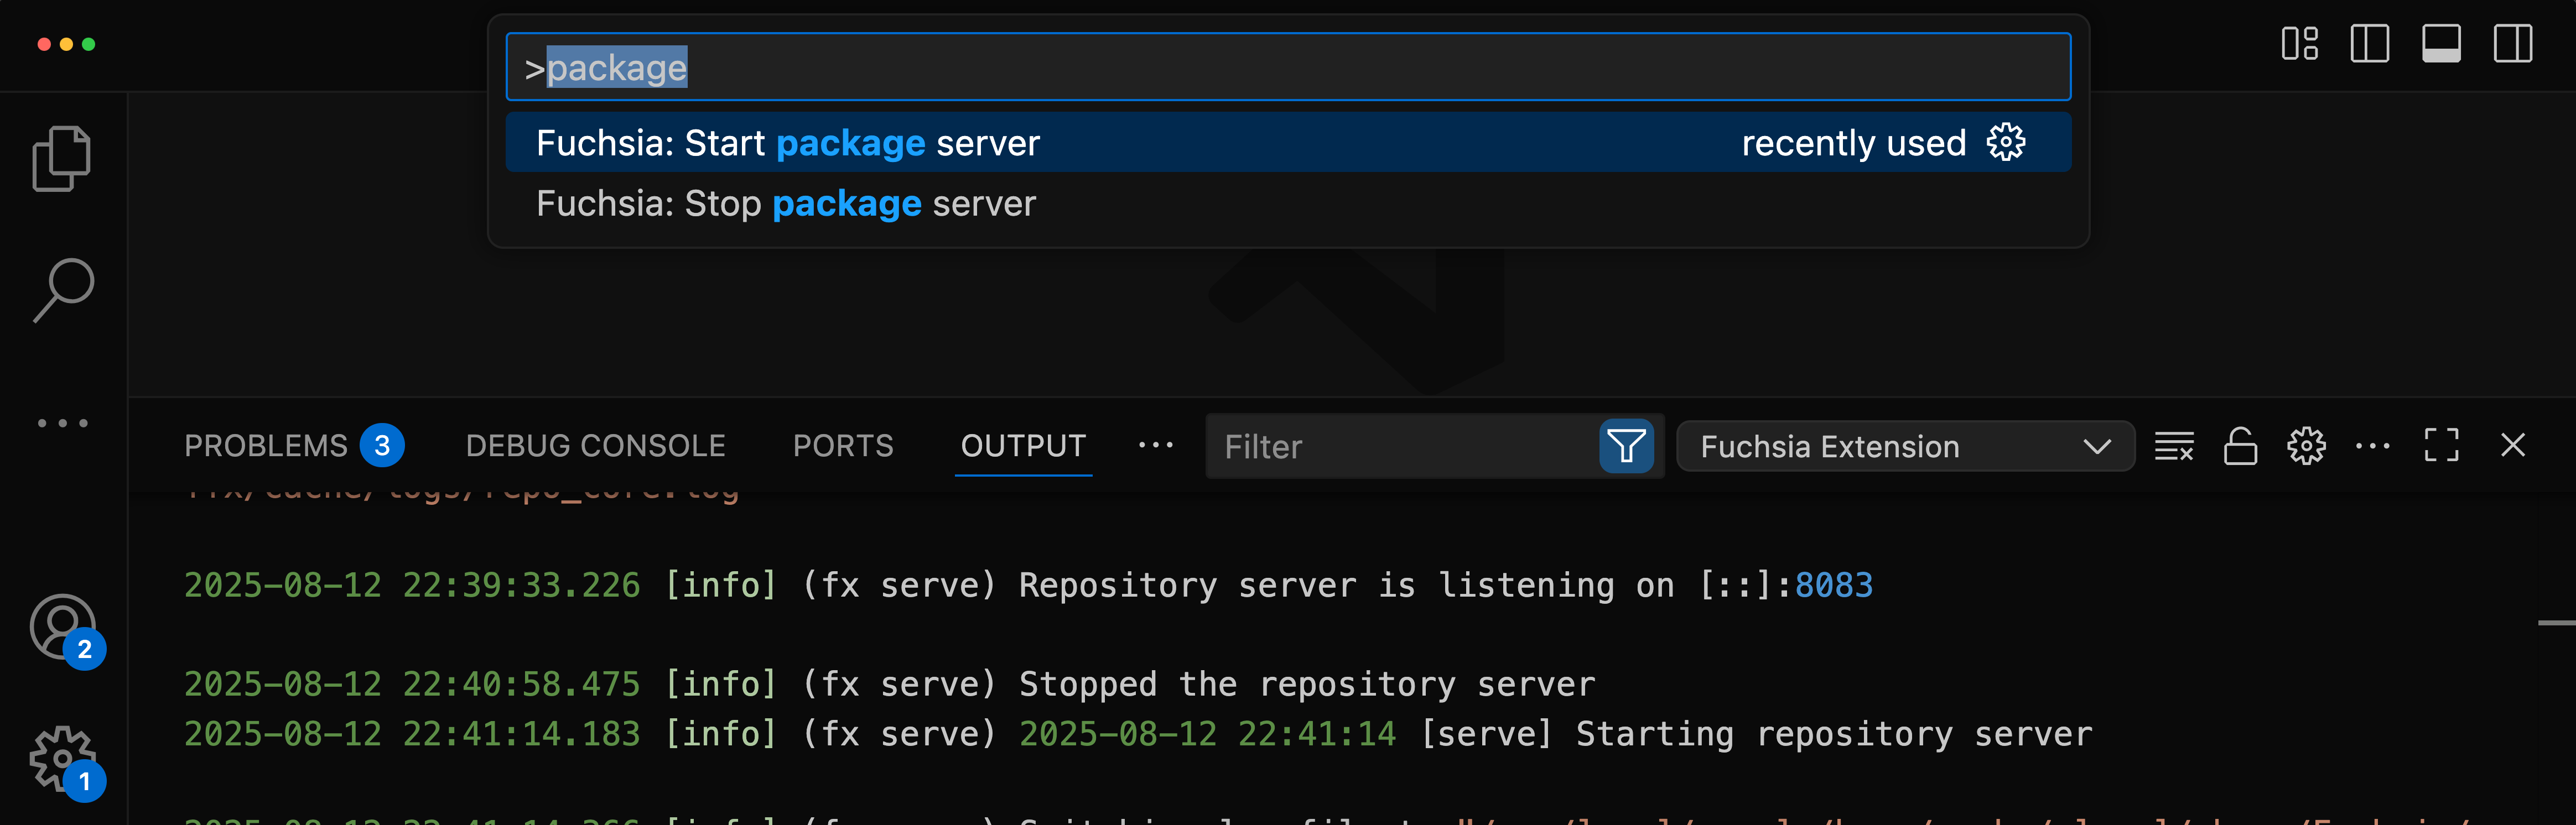
fx serve
Start and stop the package server from the command palette.
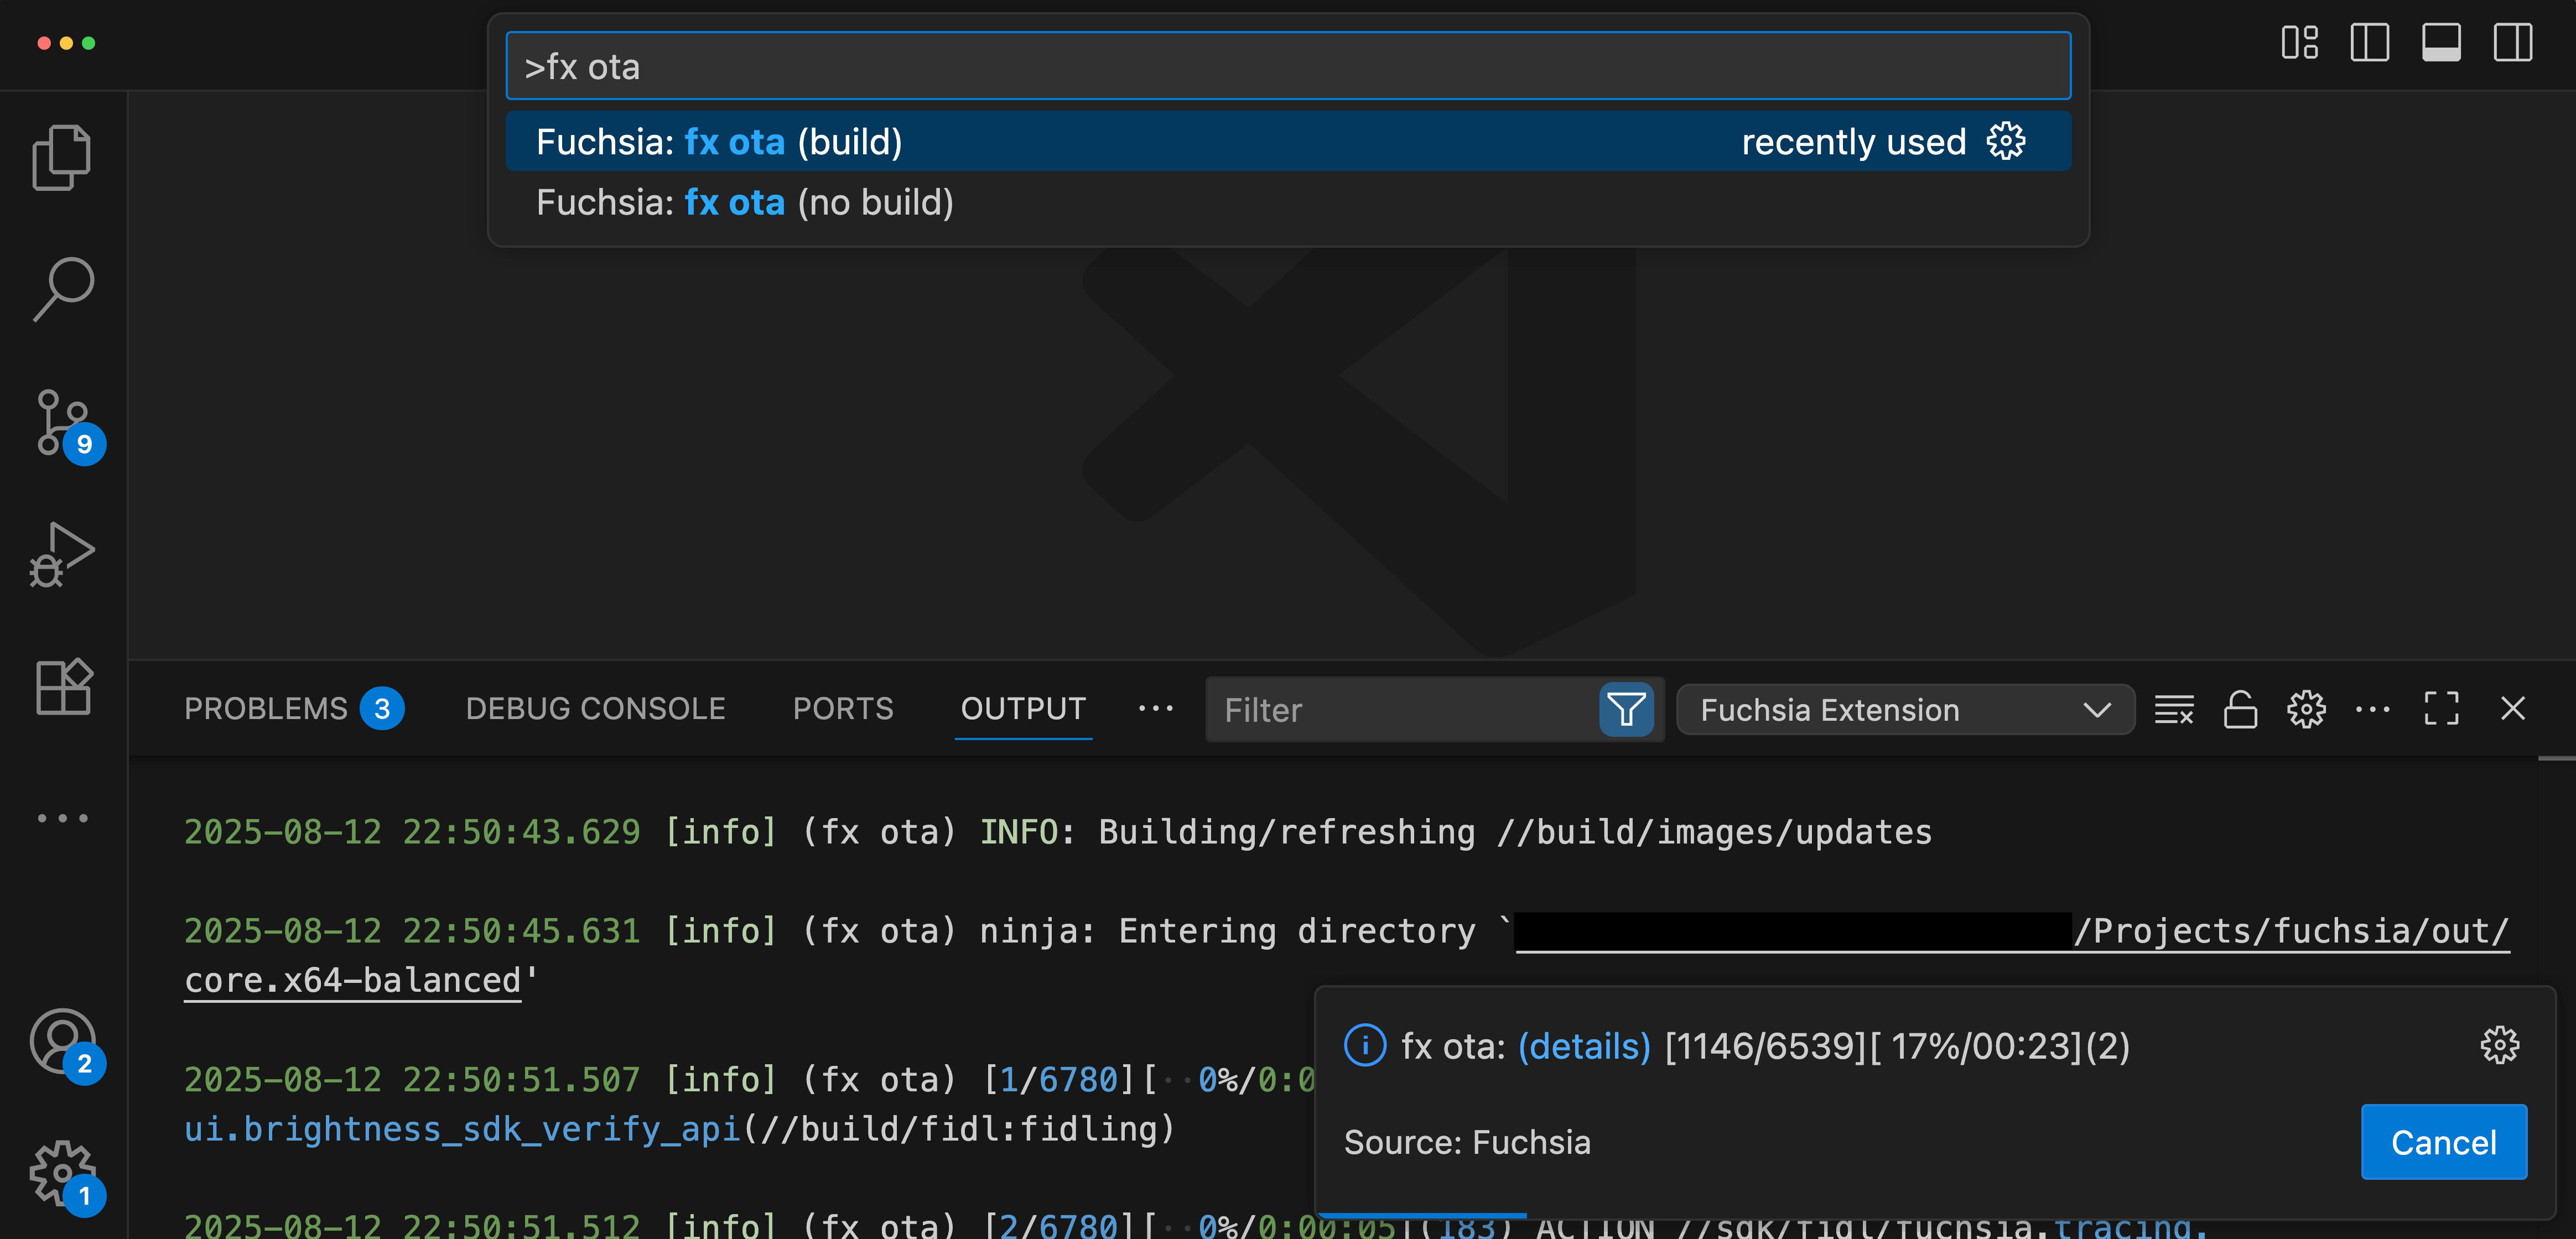
fx ota
Trigger an over-the-air update for a connected device.
Target management
Connect to a Fuchsia device
The Fuchsia extension allows you to connect to a Fuchsia target which can be a physical device or an emulator. The extension supports multiple target devices and allows you to easily switch between various Fuchsia devices. You can only connect to a single device at any given time.
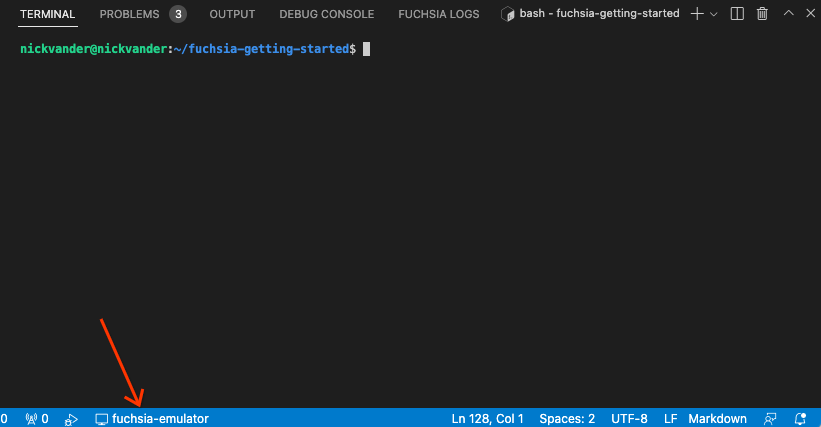
If your emulator is properly configured and started, you should see a and the name of your Fuchsia device in the status bar of VS Code. If you are using the emulator and not seeing a Fuchsia device, see Start the Fuchsia emulator.
Target interaction
You can click the and the name of your Fuchsia device in the status bar of VS Code to see the various options that you have for your Fuchsia devices.
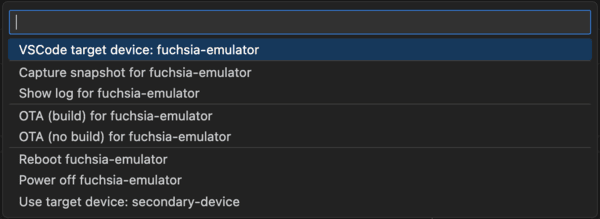
- VSCode Target device:
<device-name>: Shows current Fuchsia device configured as the active target for the Fuchsia VSCode extension's features. - Switching between targets: If you have additional targets, select
Use target device: <device-name>to switch to that specific target. - Emulator control: Start and stop the Fuchsia emulator (
ffx emu). - Target controls: Reboot or power off a connected target. Reboot shows until the target is available.
- Capturing a snapshot: Capture a snapshot of the active device.
Viewing Logs
The Fuchsia extension allows you to view the symbolized logs
(human-readable stack traces) for your connected Fuchsia device. This is equivalent
to running ffx log. For more information on ffx log, see
Monitor device logs.
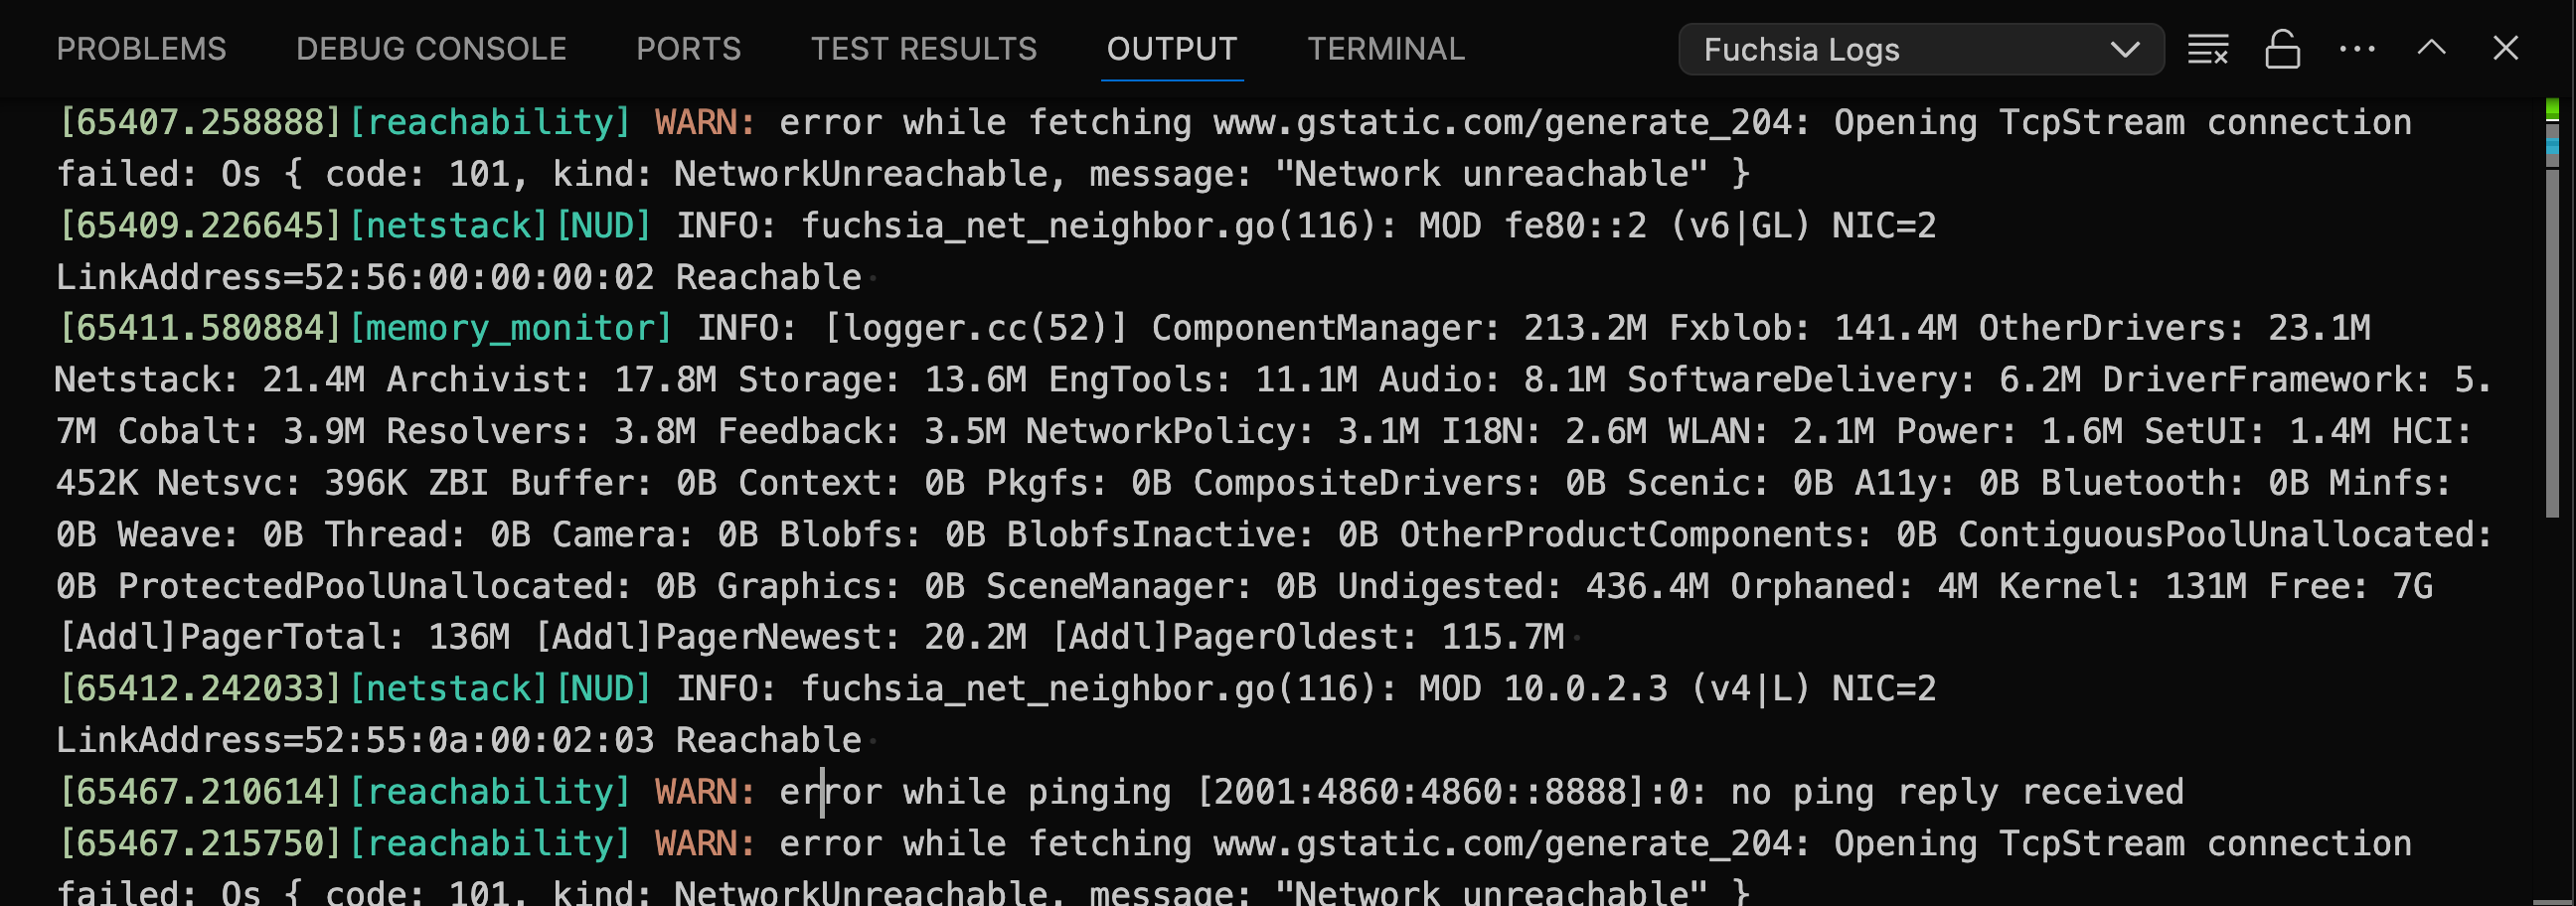
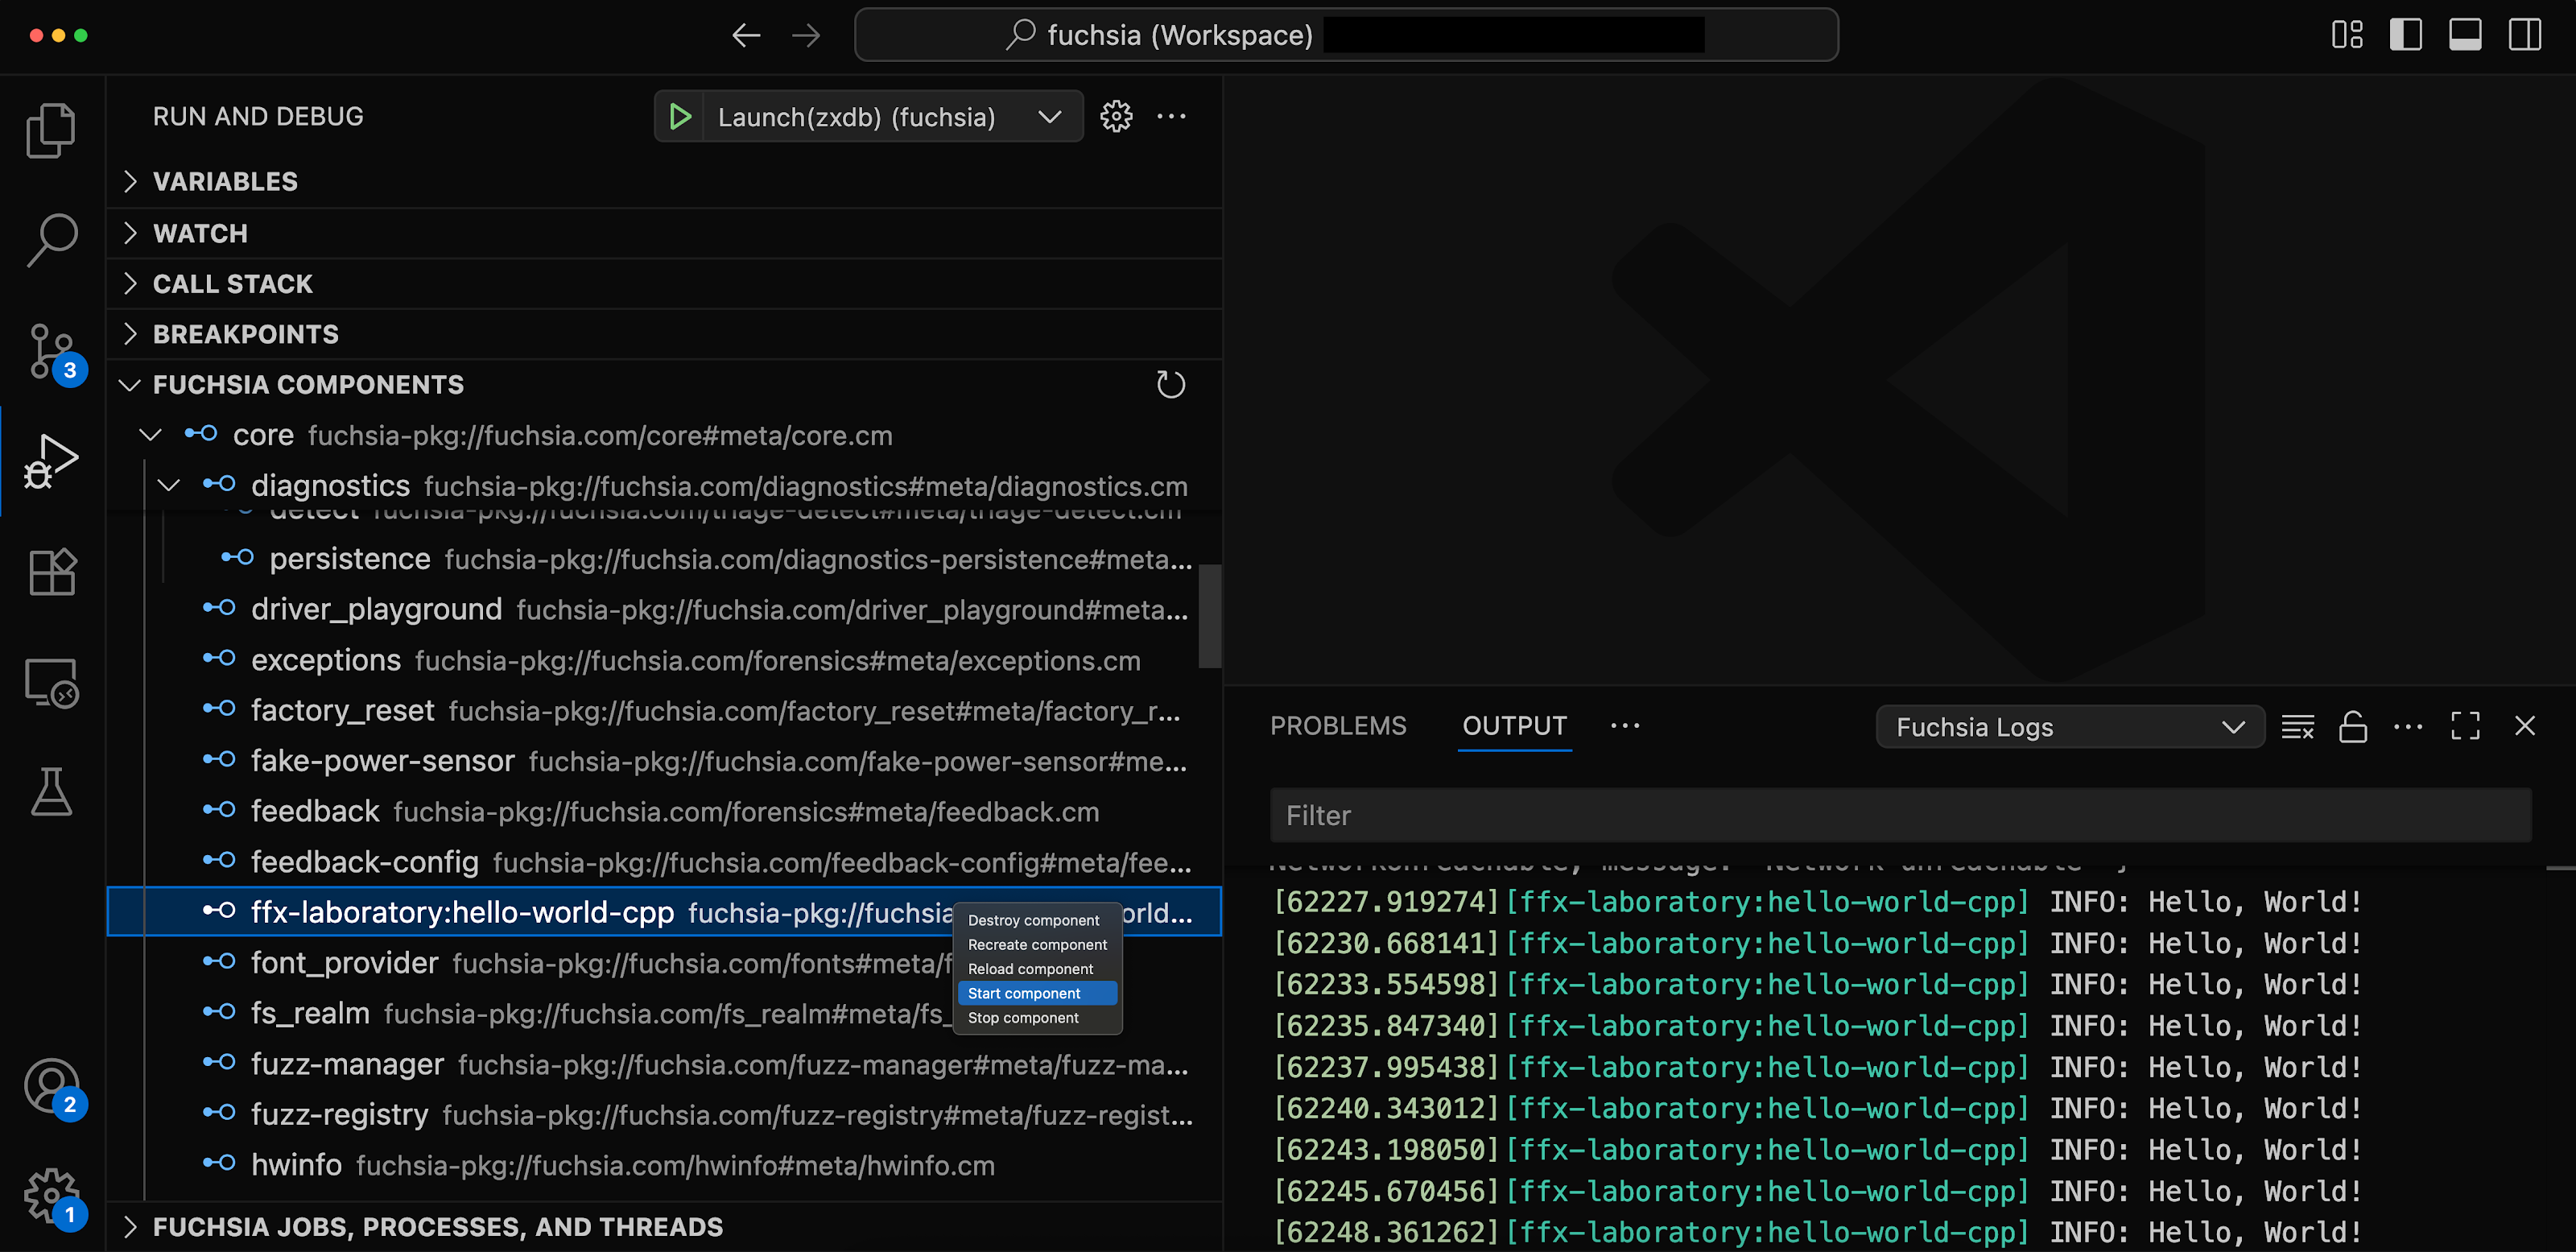
Select Fuchsia logs from the drop-down in the Output tab to see the device logs.
Clear Fuchsia logs
Once the Fuchsia extension has streamed the Fuchsia logs, you can clear the listed Fuchsia logs to see the incoming logging events for your Fuchsia device.
To clear the Fuchsia logs, click the in the top right corner of the Fuchsia logs tab.
Auto-scroll Fuchsia logs
To toggle auto-scroll for Fuchsia logs, click the in the top right corner of the Fuchsia logs tab.
Debug code
The Fuchsia extension integrates the zxdb debugger into the VS Code IDE.
Component explorer
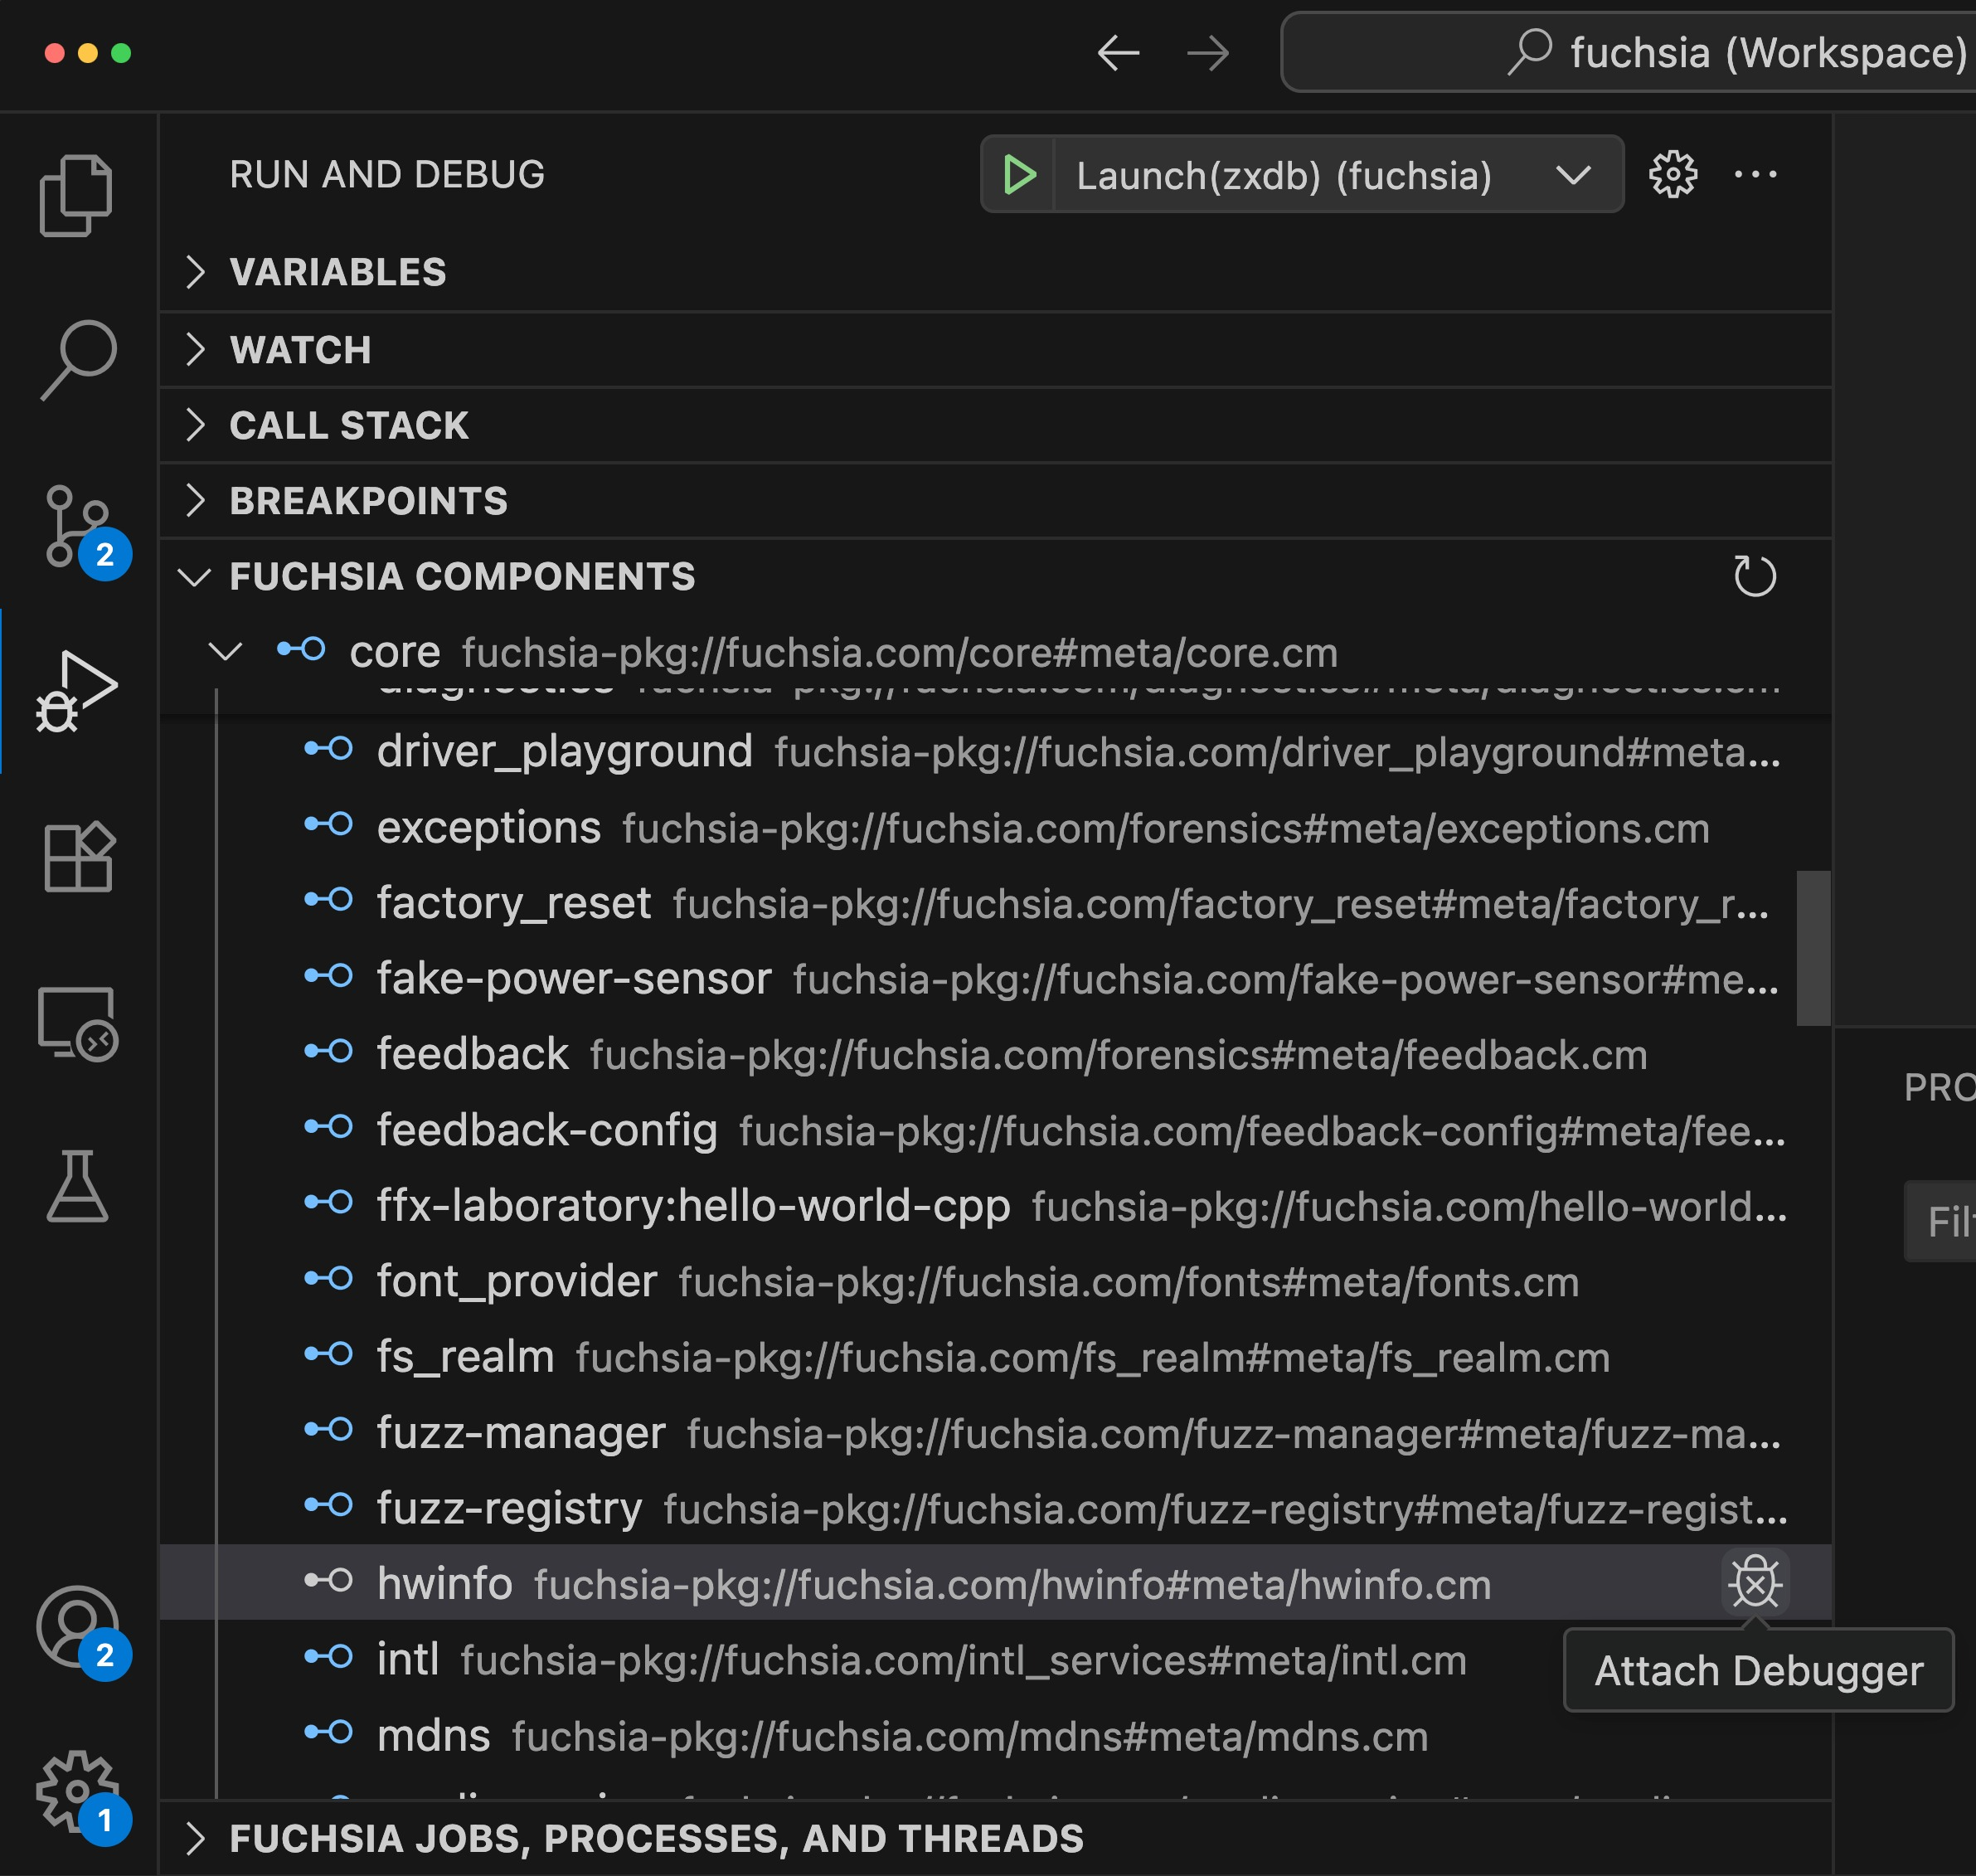
The Fuchsia extension provides a tree view of components on your Fuchsia device.
This is the equivalent of running ffx component list.
To view the Fuchsia component list, open Run and Debug in the Activity Bar
and expand the Fuchsia Components section.
To debug a component, click the to the right of the component name.
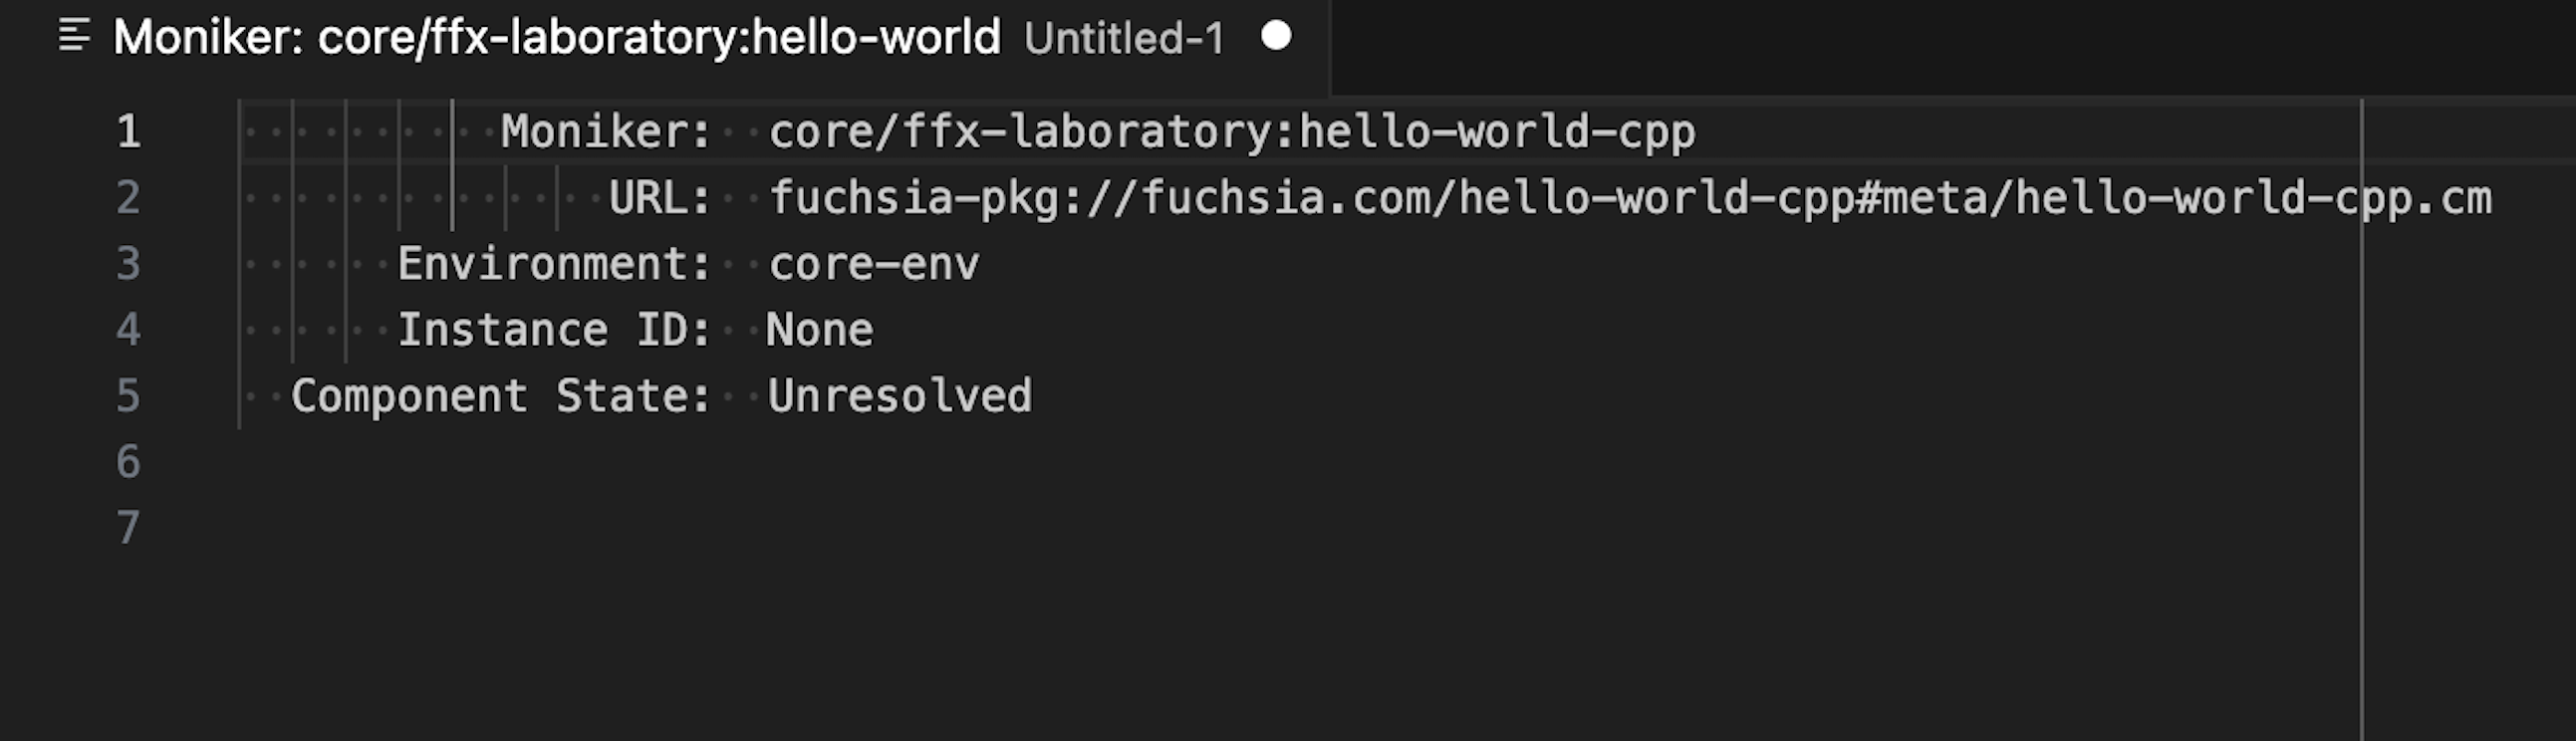
You can hover over a component to see its lifecycle information or click on it to
view more details. This opens a new window with details of the component and is the
equivalent of running ffx component show <component-name>.
You can right click a component to control the component's lifecycle. For more information, see Component lifecycle.
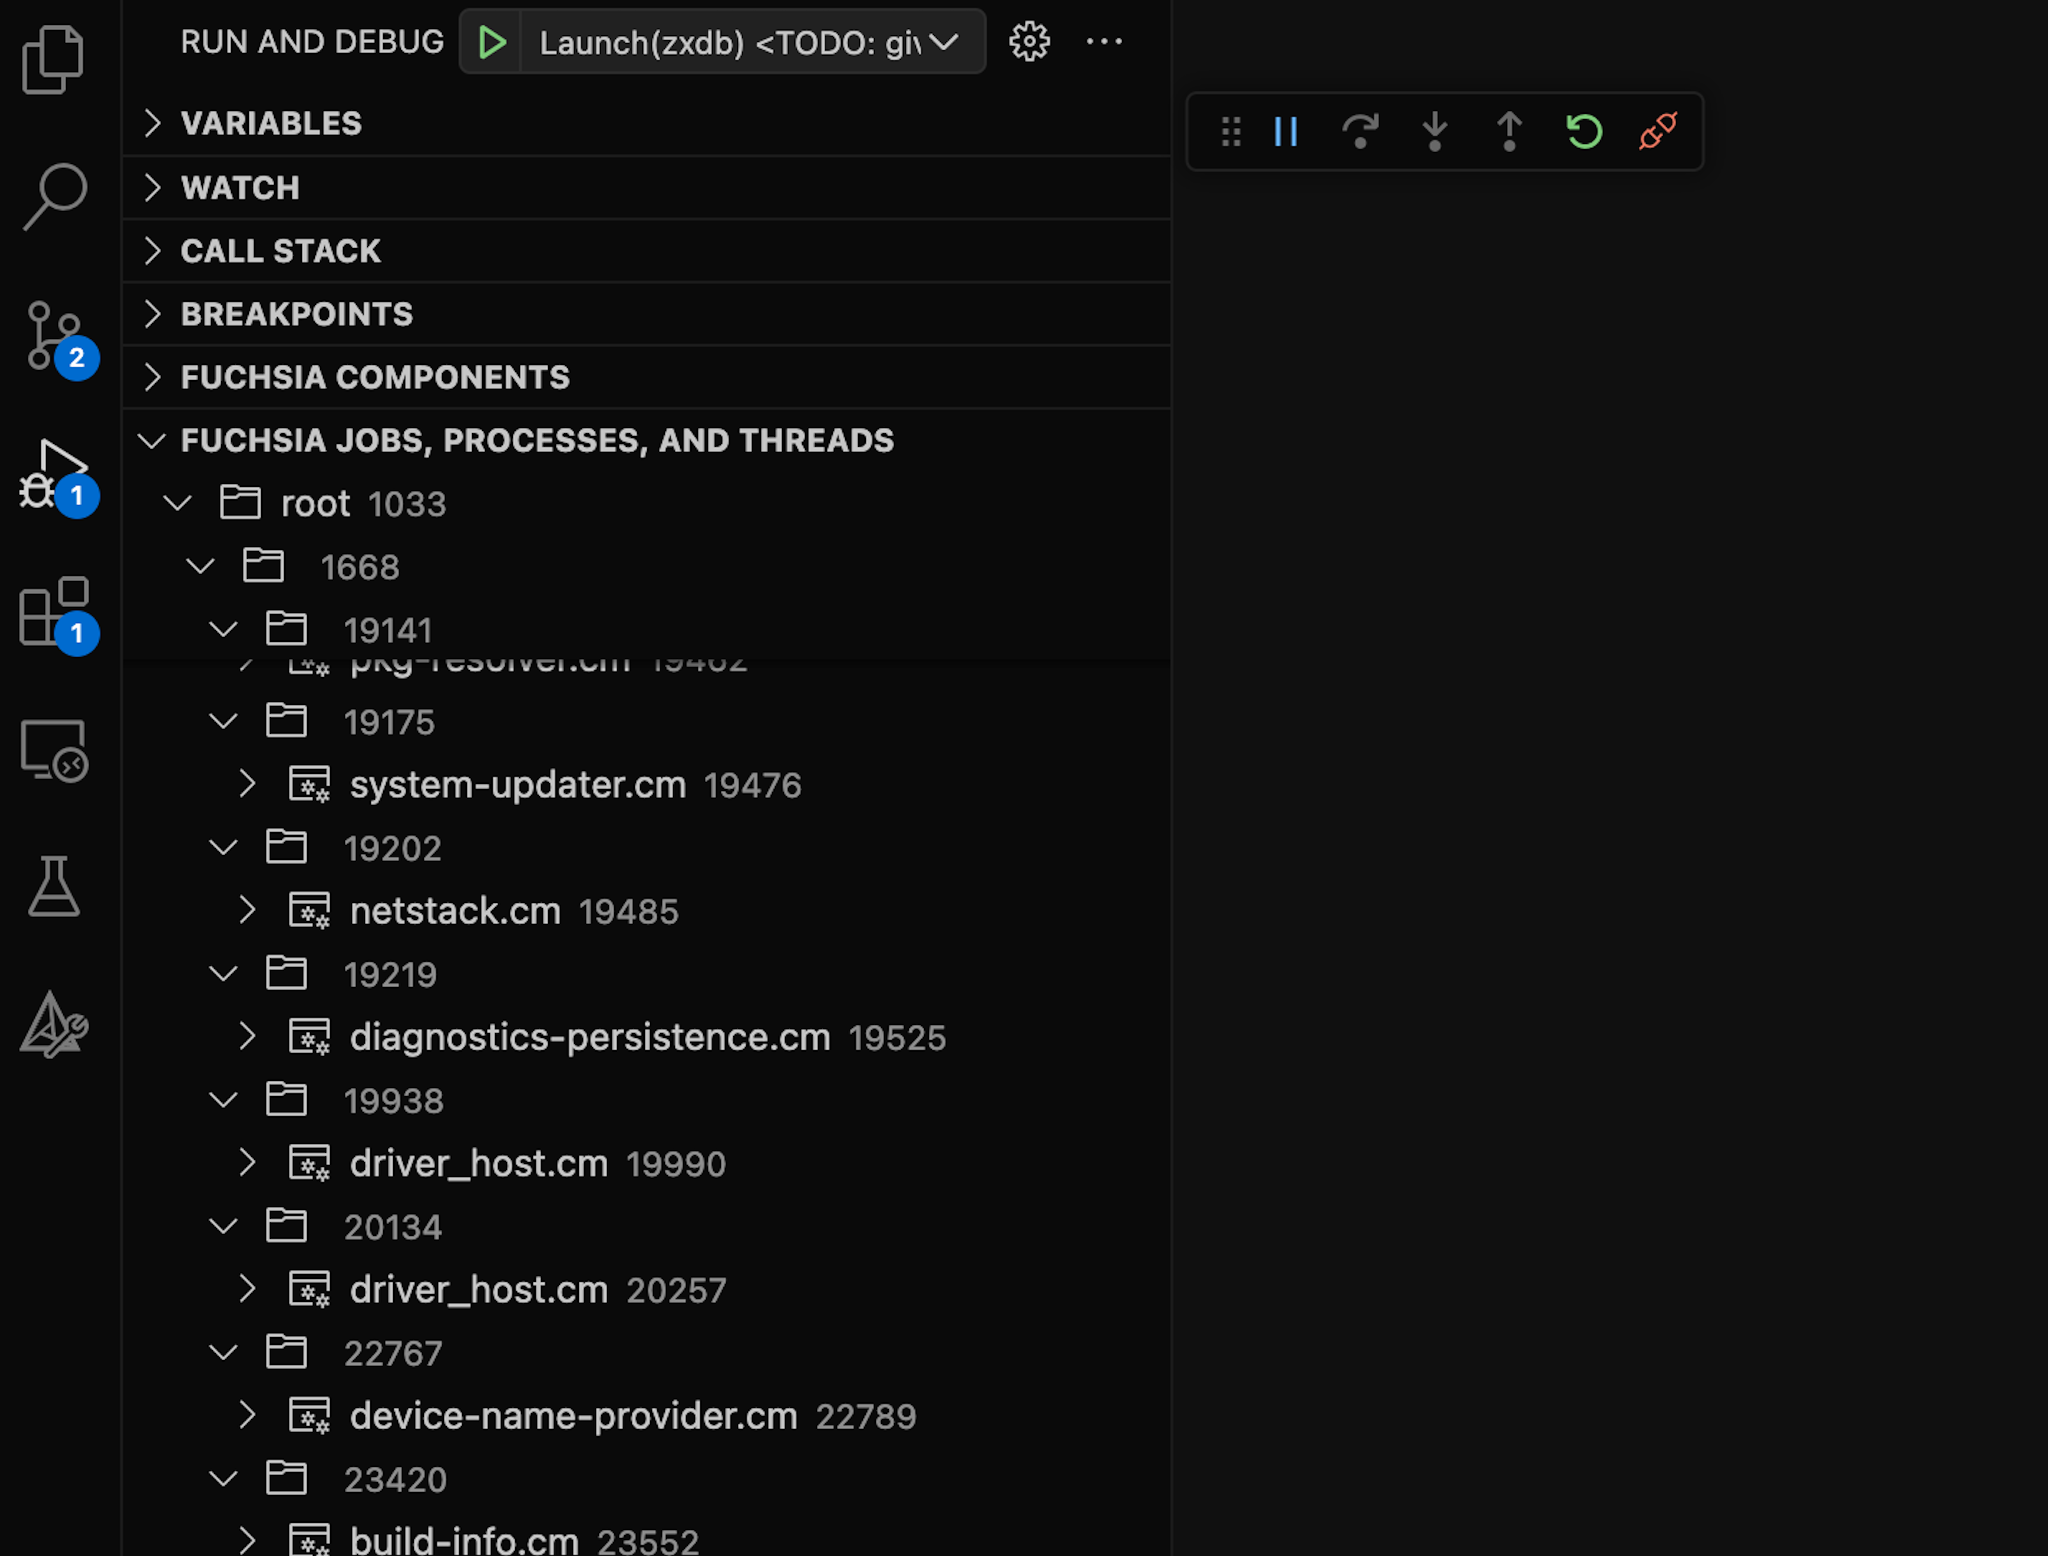
Task explorer
The Fuchsia extension provides a tree view of all jobs, processes, and threads running in the Fuchsia system. To view the Fuchsia task explorer, open Run and Debug and expand the Fuchsia Jobs, Processes, and Threads section.
To attach a debugger to a task, click the to the right of the process.
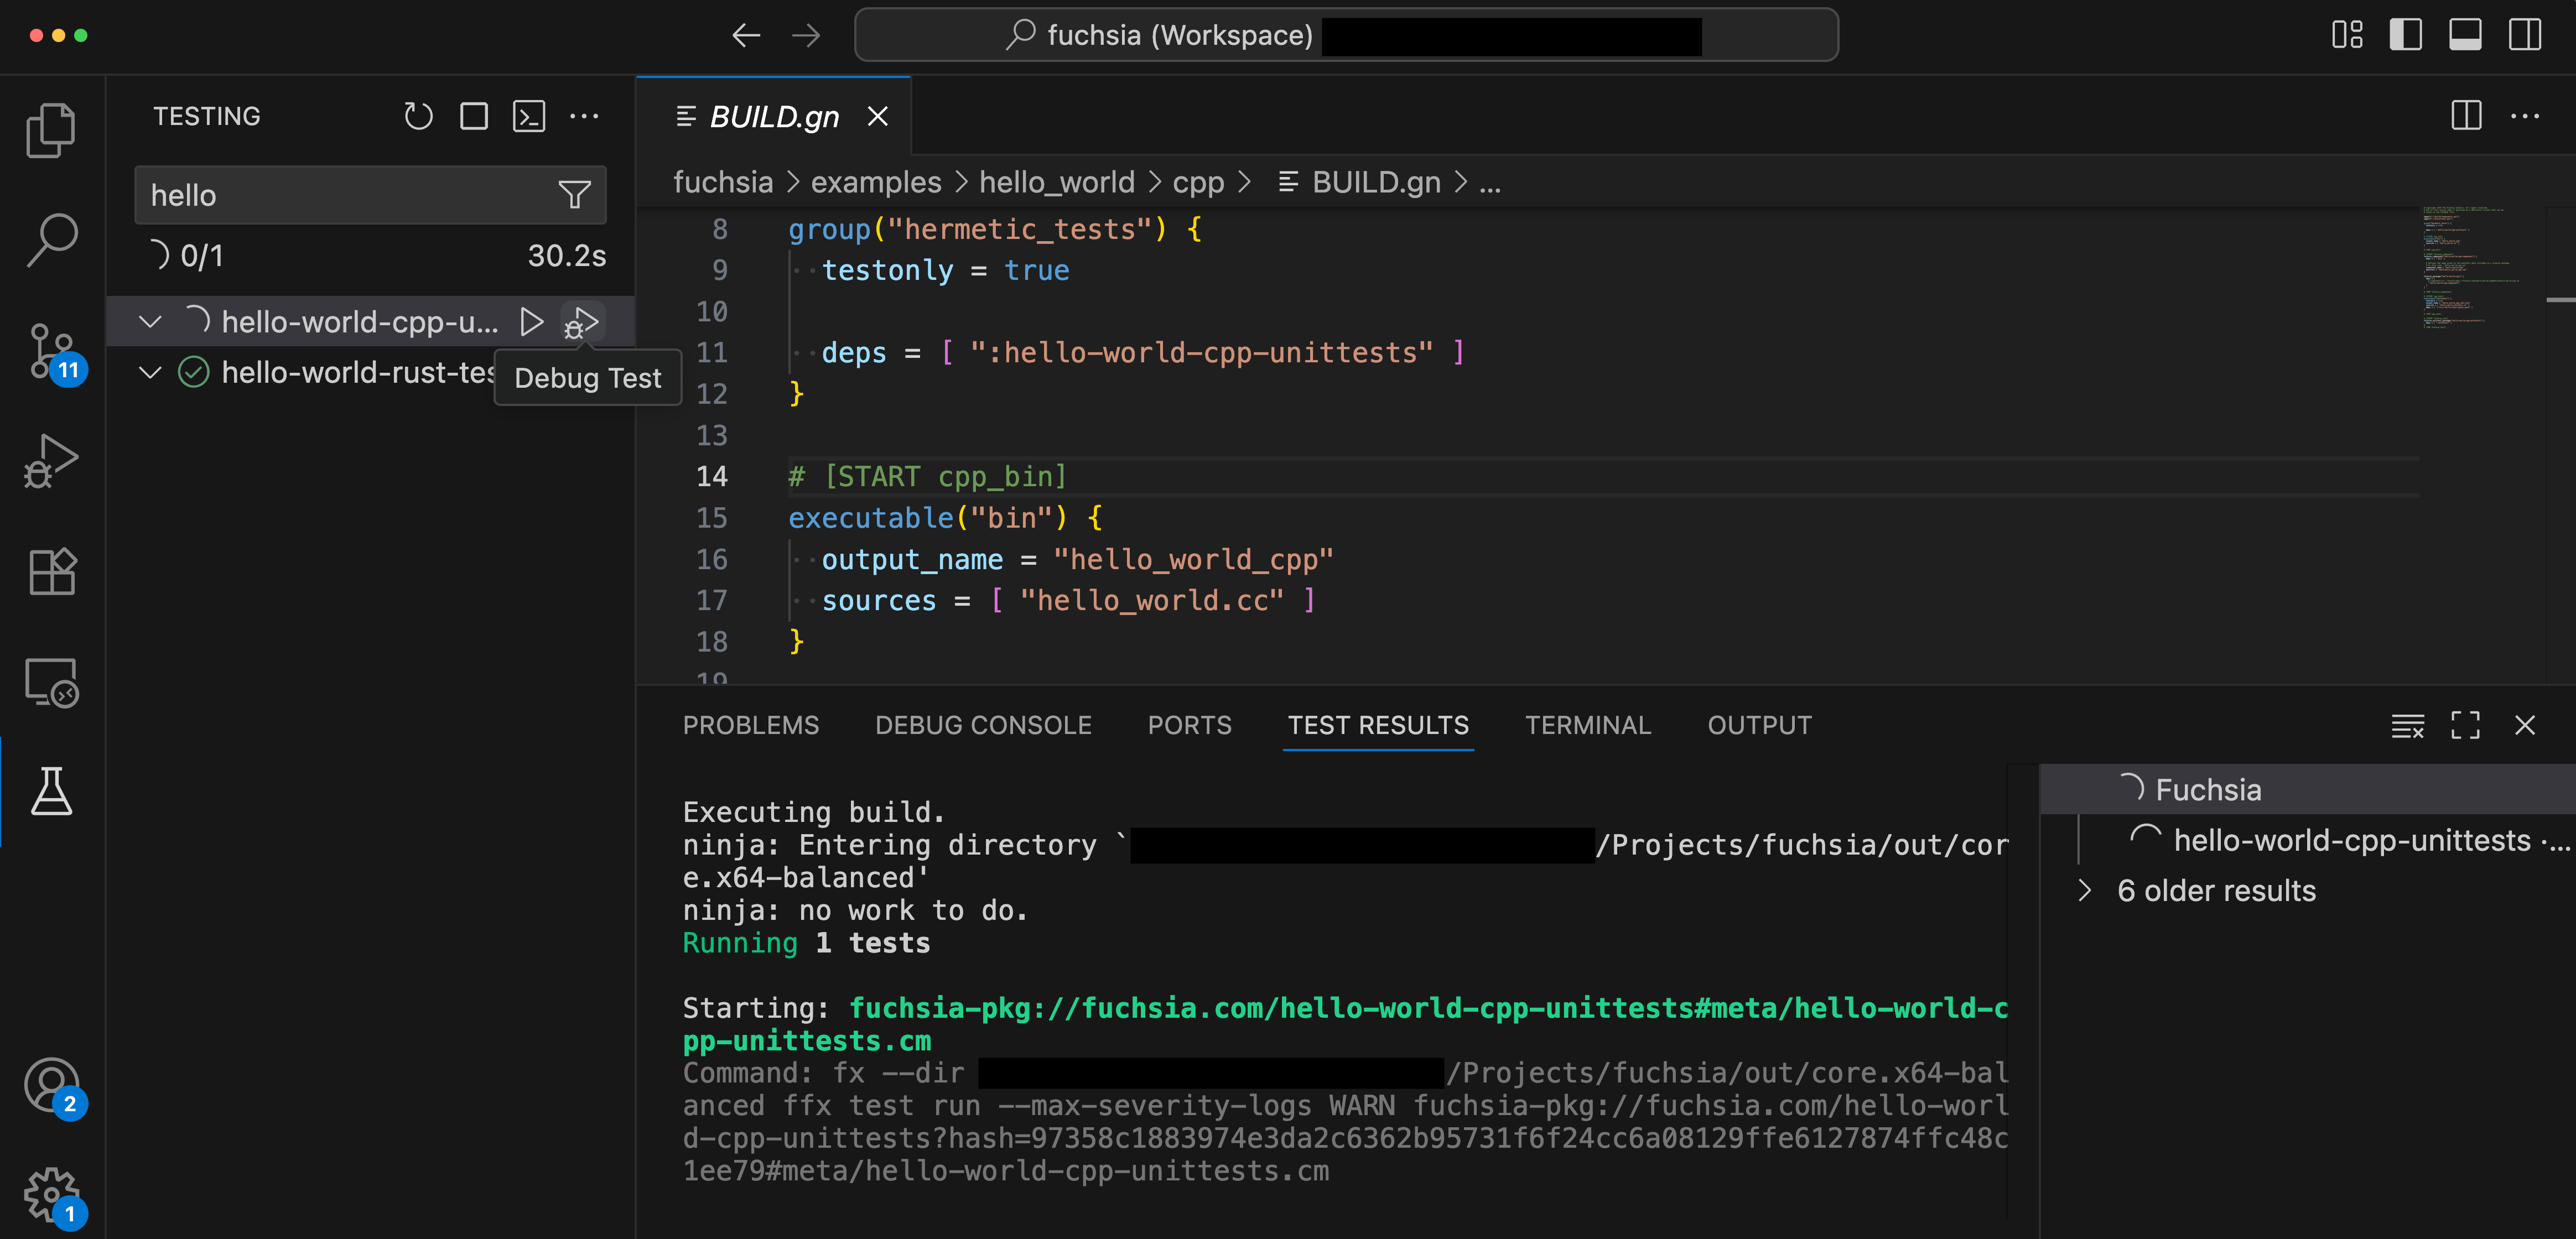
Testing
Test explorer
Run and debug tests within the VS Code UI. You can find the Test Explorer in the activity bar.