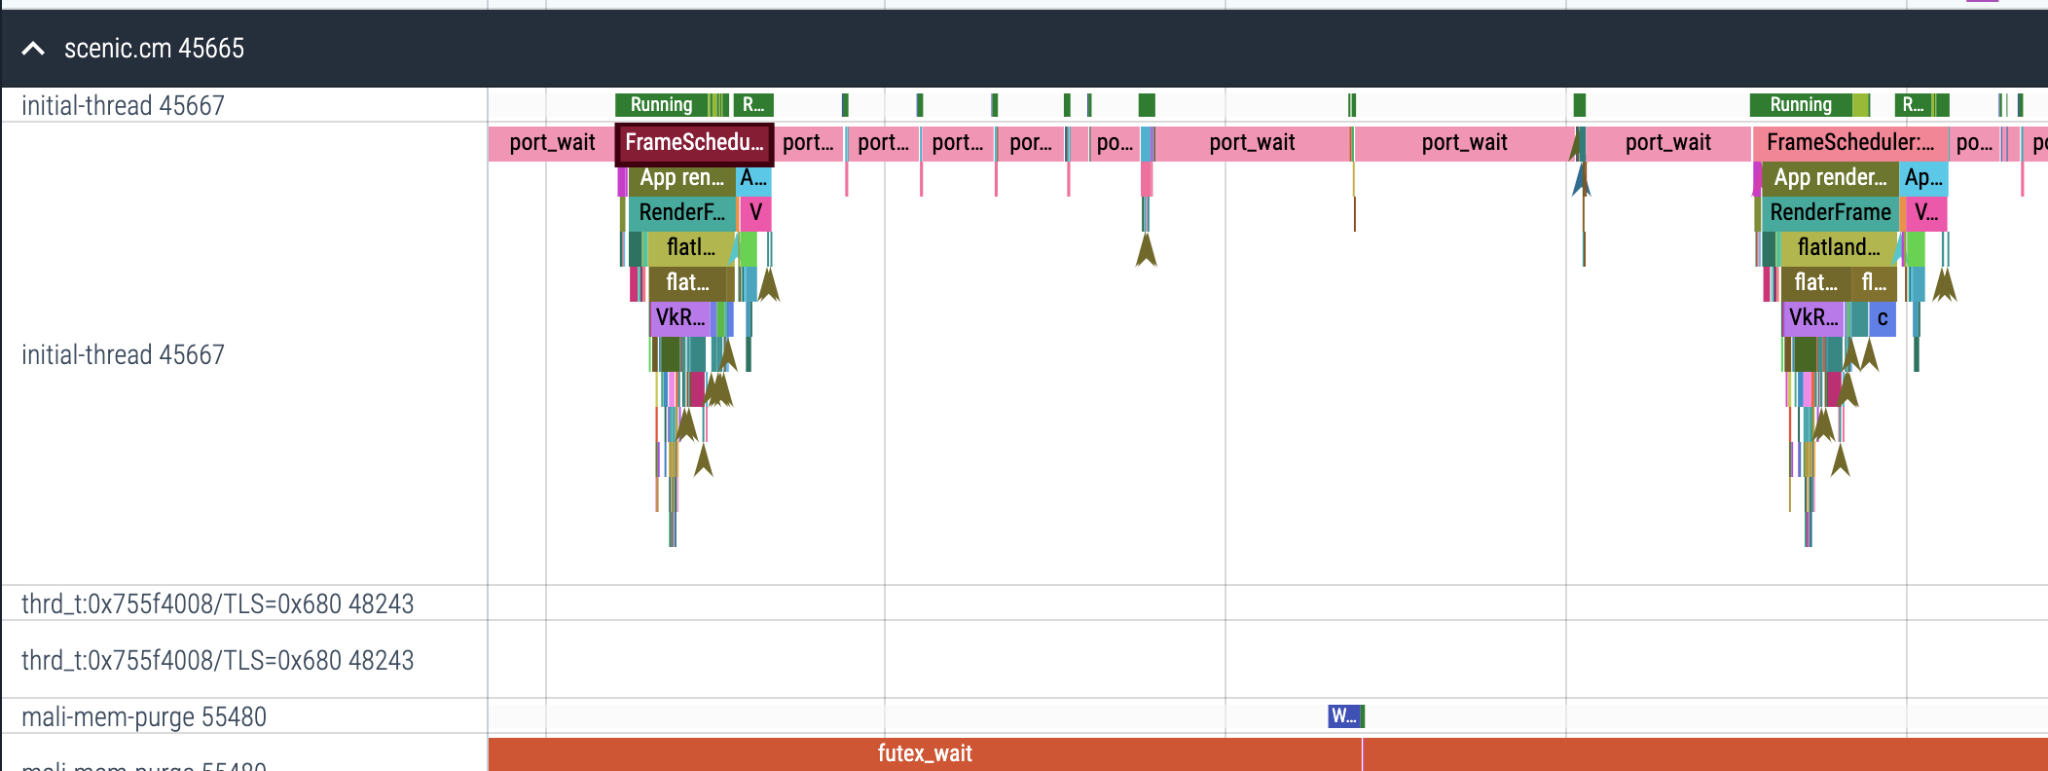
This page describes how to record and visualize a trace on a Fuchsia device with the Fuchsia tracing system.
Prerequisites
Many existing Fuchsia components are already registered as trace providers, whose trace data often provide a sufficient overview of the system. For this reason, if you only need to record a general trace (for instance, to include details in a bug report), you may proceed to the sections below. However, if you want to collect additional, customized trace events from a specific component, you need to complete the following tasks first:
Record a trace
To record a trace on a Fuchsia device from your host machine, run the following command:
ffx trace start --duration <SECONDS>This command starts a trace with the default settings, capturing a general overview of the target device.
The trace continues for the specified duration (or until the ENTER key
is pressed if a duration is not specified). When the trace is finished, the
trace data is automatically saved to the trace.fxt file in the
current directory (which can be changed by specifying the --output flag;
for example, ffx trace start --output <FILE_PATH>). To visualize the trace
results stored in this file, see the Visualize a trace
section below.
Visualize a trace
Fuchsia trace format (.fxt) is Fuchsia's
binary format that directly encodes the original trace data. To
visualize an .fxt trace file, you can use the
Perfetto viewer.
Do the following:
- Visit the Perfetto viewer site on a web browser.
- Click Open trace file on the navigation bar.
- Select your
.fxtfile from the host machine.
This viewer also allows you to use SQL to query the trace data.
Categories
Categories allow you to control which events you want to see. For example:
- Trace with all the default categories as well as "cat":
ffx trace start --categories '#default,cat'- Trace with no defaults, only scheduler and thread/process data:
ffx trace start --categories "kernel:sched,kernel:meta"Useful categories
kernel:sched + kernel:meta
High granularity overview of what is running on each CPU

kernel:ipc
Emit an event for each FIDL call and connect them with flows

kernel:syscall
Emit an event for every syscall system wide

gfx
View frame timing breakdowns

