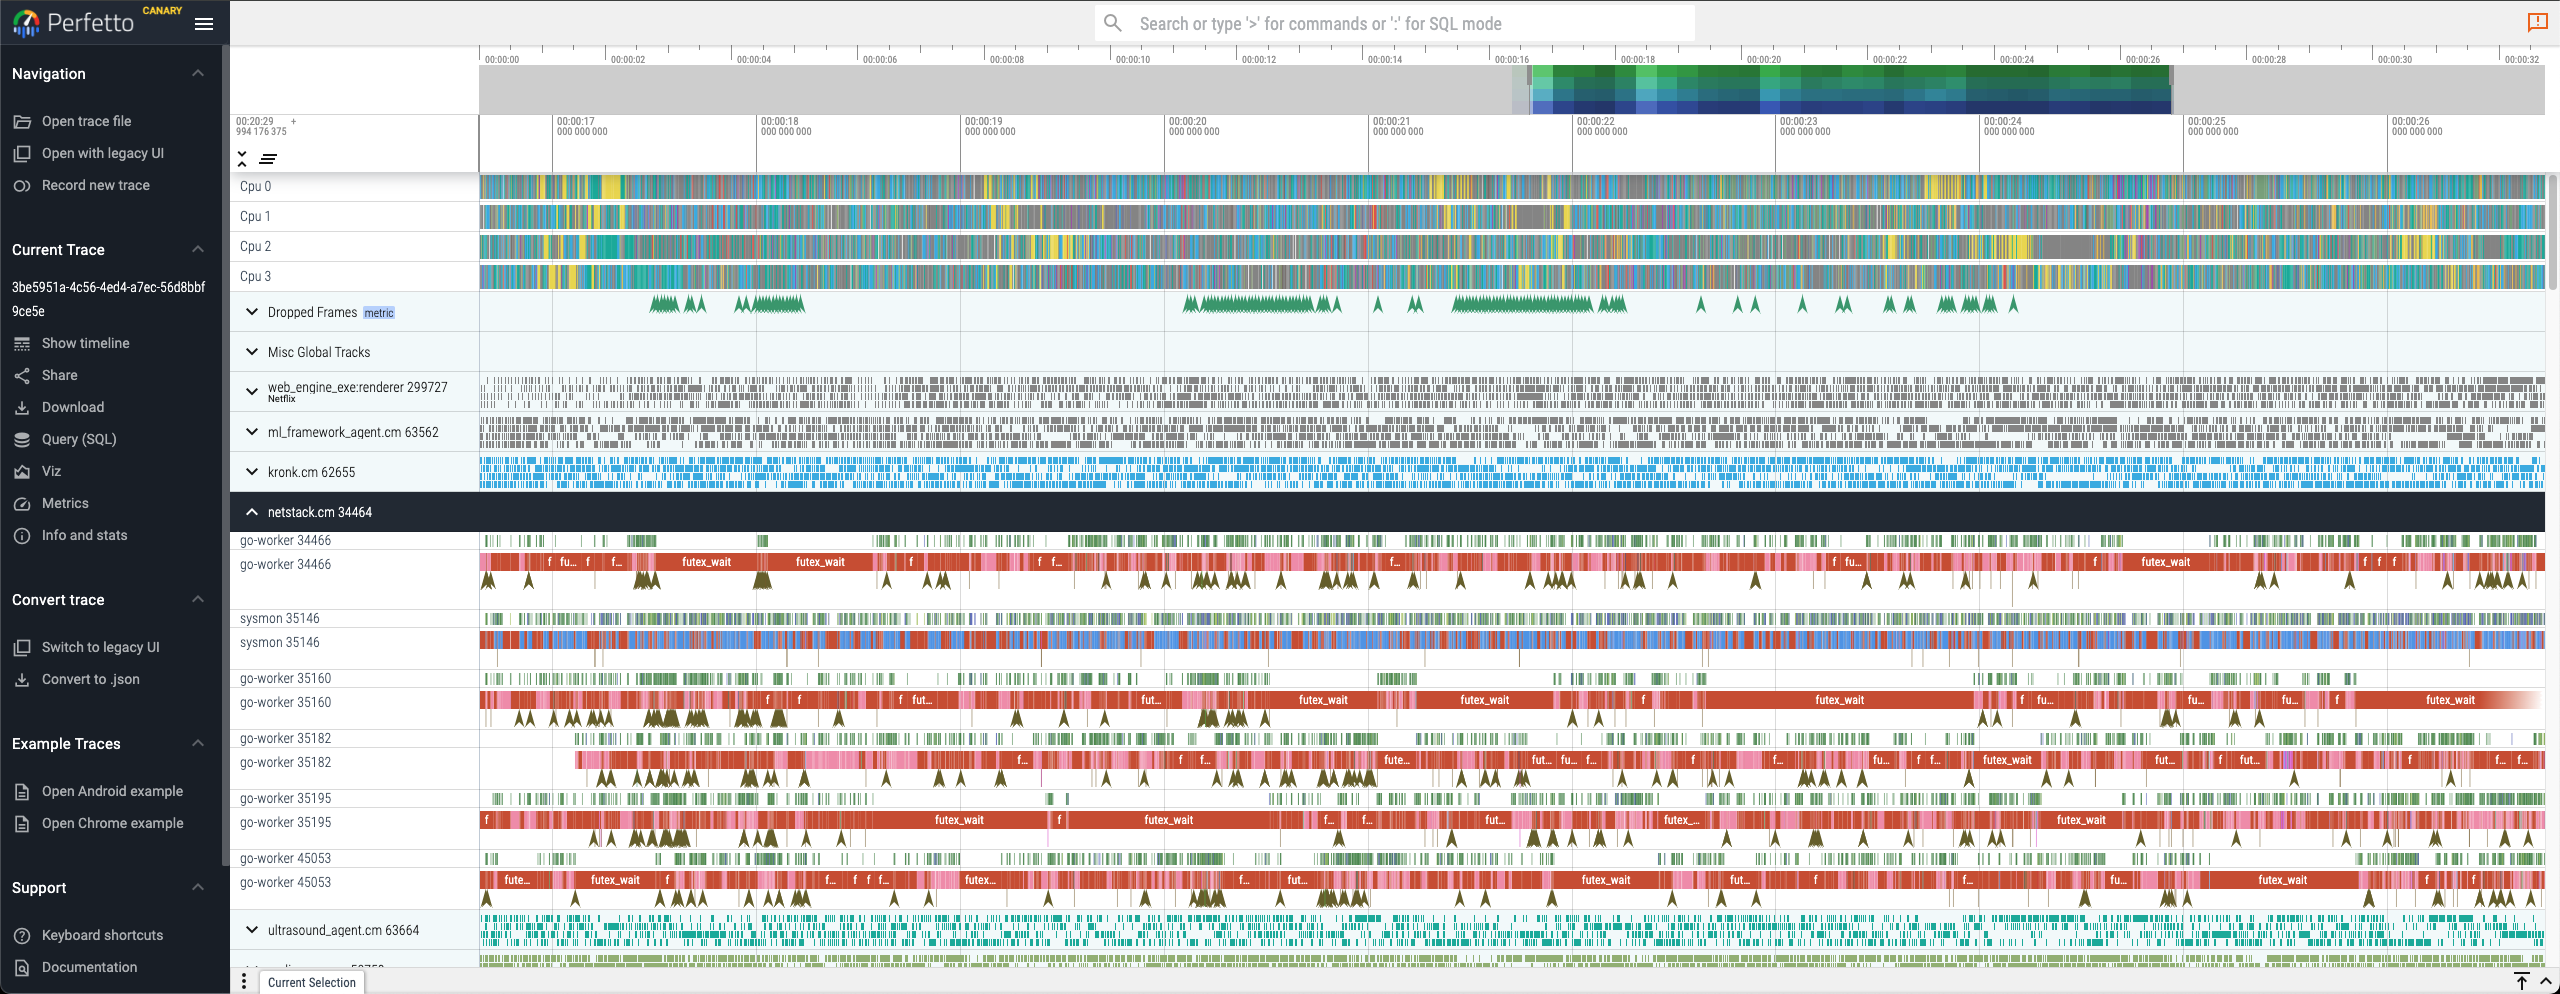
Tutorial on Fuchsia tracing
Tracing is a powerful observability tool that can assist in quickly getting a
high level overview of a running system to find and diagnose issues. You can
think of tracing like visualizable, queryable, and toggleable printf debugging.

By enabling various categories, you can visualize the following (and more):
- High granularity breakdown of which threads are scheduled on each core
- Customizable per component trace events and spans
- FIDL calls between processes and threads
- A record of every single syscall
- Network and file system activity
- High level understanding of how a component operates and communicates
Step 1 of this tutorial walks through through how to take a trace, what's
available to trace, and how to visualize it.
You can unlock deeper analysis by adding custom trace points to your component
as well. Steps 2 and 3 explain how to add new trace points to a component.
- Record and visualize a trace.
- Register a trace provider.
- Add tracing in your code.
Except as otherwise noted, the content of this page is licensed under the Creative Commons Attribution 4.0 License, and code samples are licensed under the Apache 2.0 License. For details, see the Google Developers Site Policies. Java is a registered trademark of Oracle and/or its affiliates.
Last updated 2025-02-28 UTC.
[[["Easy to understand","easyToUnderstand","thumb-up"],["Solved my problem","solvedMyProblem","thumb-up"],["Other","otherUp","thumb-up"]],[["Missing the information I need","missingTheInformationINeed","thumb-down"],["Too complicated / too many steps","tooComplicatedTooManySteps","thumb-down"],["Out of date","outOfDate","thumb-down"],["Samples / code issue","samplesCodeIssue","thumb-down"],["Other","otherDown","thumb-down"]],["Last updated 2025-02-28 UTC."],[],[]]

