When you instrument a Fuchsia component as a tracing provider, you can create and observe various types of events. This document explains the differences between the types of events, the best use cases for each type of event, how to use events in your components, and the various arguments that you can use in a tracing event.
Events
A Fuchsia event type can be any of the following:
- Instant event Marks a point of time that has a name, category, and optional arguments.
- Duration event Marks two points in time and can contain a name, category, and optional arguments.
- Counter event Captures numeric samples that are typically represented in Perfetto as a stacked area chart.
- Flow event Describes flow handoffs between threads and across processes.
- Async event
Allows specifying an
idthat links events across different threads together and places these events on a single track.
In its most basic form, a trace event has a category (the first parameter) and a name (the second parameter).
A trace event can accept up to 15 arguments.
When you use trace events, it is important to understand how categories work. The following are some key concepts related to categories:
- Categories allow you to group events so that you can enable or disable them together.
- Categories are typically short ASCII string literals of
[A-Za-z-_:]+such asgfxoraudio. - Categories are global. Consider namespacing them to your component.
- Categories are not enabled by default. If you add a category, make sure that
you specify it when you capture a trace with
--categories #default,your_category. ffx tracesupports prefix matching. If you runffx trace start --categories your_component::*, this enablesyour_component::category1,your_component::category2, and any other associated categories.
When you use an event, make sure to include the relevant library in your code:
C
#include <lib/trace/event.h>
C++
#include <lib/trace/event.h>
Rust
use fuchsia_trace::{ArgValue, Scope, ...};
You can also see a simple example in C++ on using a trace provider.
Instant event
This is the most basic of events. An instant event can mark a point of time that has a name, category, and optional arguments.
Categories can optionally be registered, but most tracing providers do not.
At the minimum, an instant trace has both a name and a category to differentiate it:
C
TRACE_INSTANT("trace_category", "trace_name", TRACE_SCOPE_THREAD);
C++
TRACE_INSTANT("trace_category", "trace_name", TRACE_SCOPE_THREAD);
Rust
instant!("trace_category", "trace_name", Scope::Thread);
You can also make an instant event that includes additional arguments:
C
TRACE_INSTANT("trace_category", "trace_name", TRACE_SCOPE_THREAD, argument_1, argument_1_value, argument_2, "argument_2_string");
C++
TRACE_INSTANT("trace_category", "trace_name", TRACE_SCOPE_THREAD, argument_1, argument_1_value, argument_2, "argument_2_string");
Rust
instant!("trace_category", "trace_name", Scope::Thread, argument_1 => argument_1_value, argument_2 => "argument_2_string");
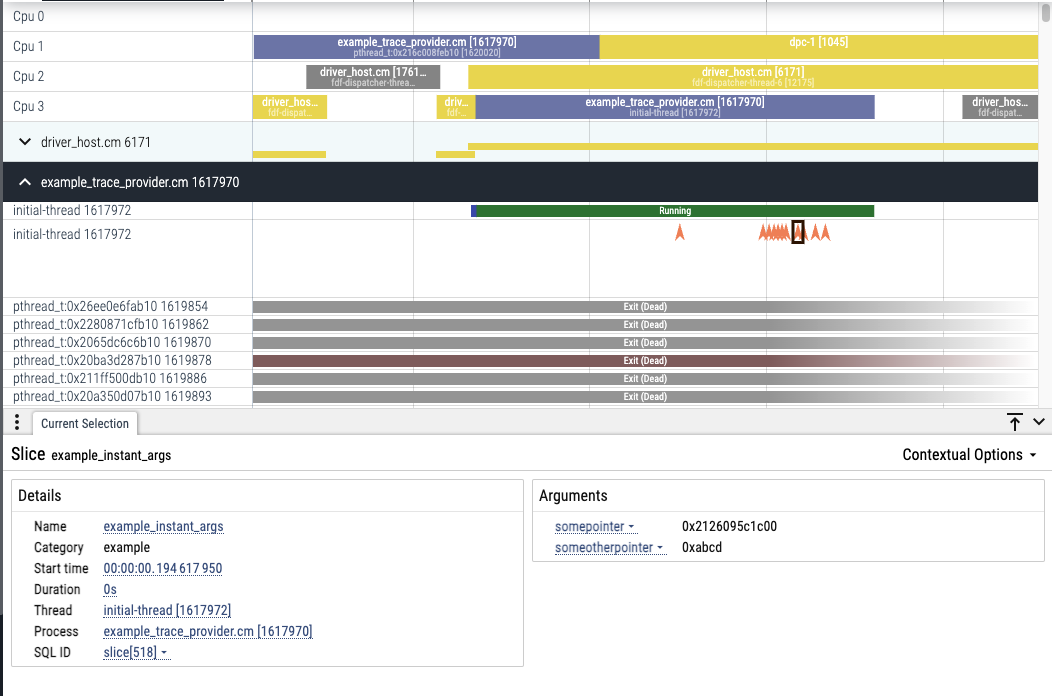
In Perfetto, an instant event is indicated by a small arrow as shown in this screenshot.

Duration event
A duration event marks two points in time and can contain a name, category, and optional arguments. Duration events can also nest within another duration event and stack on top of one another.
At a minimum a duration trace has both a name and a category to differentiate it:
C
TRACE_DURATION_BEGIN("trace_category", "example_duration");
// Do some work
TRACE_DURATION_END("trace_category", "example_duration");
C++
TRACE_DURATION_BEGIN("trace_category", "example_duration");
// Do some work
TRACE_DURATION_END("trace_category", "example_duration");
Rust
duration_begin!("trace_category", "example_duration");
// Do some work
duration_end!("trace_category", "example_duration");
Alternatively, you can define a duration event and automatically close it when it goes out of scope using RAII (Resource acquisition is initialization) as follows::
C
{
  TRACE_DURATION("trace_category", "example_duration_raii");
  // Do some work
  TRACE_DURATION("trace_category", "nested duration", "argument_3", argument_3_value, "argument_4", argument_4_string);
  // nested_duration closes due to RAII
  // trace_duration_raii closes due to RAII
}
C++
{
  TRACE_DURATION("trace_category", "example_duration_raii");
  // Do some work
  TRACE_DURATION("trace_category", "nested duration", "argument_3", argument_3_value, "argument_4", argument_4_string);
  // nested_duration closes due to RAII
  // trace_duration_raii closes due to RAII
}
Rust
{
  duration!("trace_category", "example_duration_raii");
  // Do some work
  duration!("trace_category", "nested duration", argument_3 => argument_3_value, argument_4 => argument_4_string);
  // nested_duration closes due to RAII
  // trace_duration_raii closes due to RAII
}
In Perfetto, a nested stack of durations looks as follows:

Counter event
A counter event captures numeric samples that are typically represented in
Perfetto as a stacked area chart. When you use a counter event, you can use the
id to distinguish between multiple instances of counters that share the same
category and name within the system process. You can associate 1-15 numeric
arguments with an event, each of which is interpreted as a distinct time series.
This example shows a counter_id value and a data series passed to a counter
event:
C
trace_counter_id_t counter_id = 555;
uint32_t data = get_some_data();
TRACE_COUNTER("trace_category", "trace_name", counter_id, "data_series", data);
C++
trace_counter_id_t counter_id = 555;
uint32_t data = get_some_data();
TRACE_COUNTER("trace_category", "trace_name", counter_id, "data_series", data);
Rust
let counter_id = 555;
let data = get_some_data();
counter!("trace_category", "trace_name", counter_id, "data_series" => data);
In Perfetto, a counter event looks as follows:

Flow event
A flow event describes flow handoffs between threads and across processes. These
events must be enclosed in a duration event which represents where the flow
handoff occurs. Each flow event may also attach arguments. A flow begin
(TRACE_FLOW_BEGIN or flow_begin) event may be followed by a flow step
(TRACE_FLOW_STEP or flow_step) event.
Perfetto requires flow event IDs to be global within a trace.
For example:
C
trace_flow_id_t flow_id = 555;
TRACE_FLOW_BEGIN("trace_category", "trace_flow_name", flow_id, "argument_1", argument_1_value);
TRACE_FLOW_STEP("trace_category", "trace_flow_step_name", flow_id);
TRACE_FLOW_END("trace_category", "trace_flow_name", flow_id);
C++
trace_flow_id_t flow_id = 555;
TRACE_FLOW_BEGIN("trace_category", "trace_flow_name", flow_id, "argument_1", argument_1_value);
TRACE_FLOW_STEP("trace_category", "trace_flow_step_name", flow_id);
TRACE_FLOW_END("trace_category", "trace_flow_name", flow_id);
Rust
let flow_id = 555;
flow_begin!("trace_category", "trace_flow_name", flow_id, "argument_1" => argument_1_value);
flow_step!("trace_category", "trace_flow_step_name", flow_id);
flow_end!("trace_category", "trace_flow_name", flow_id);
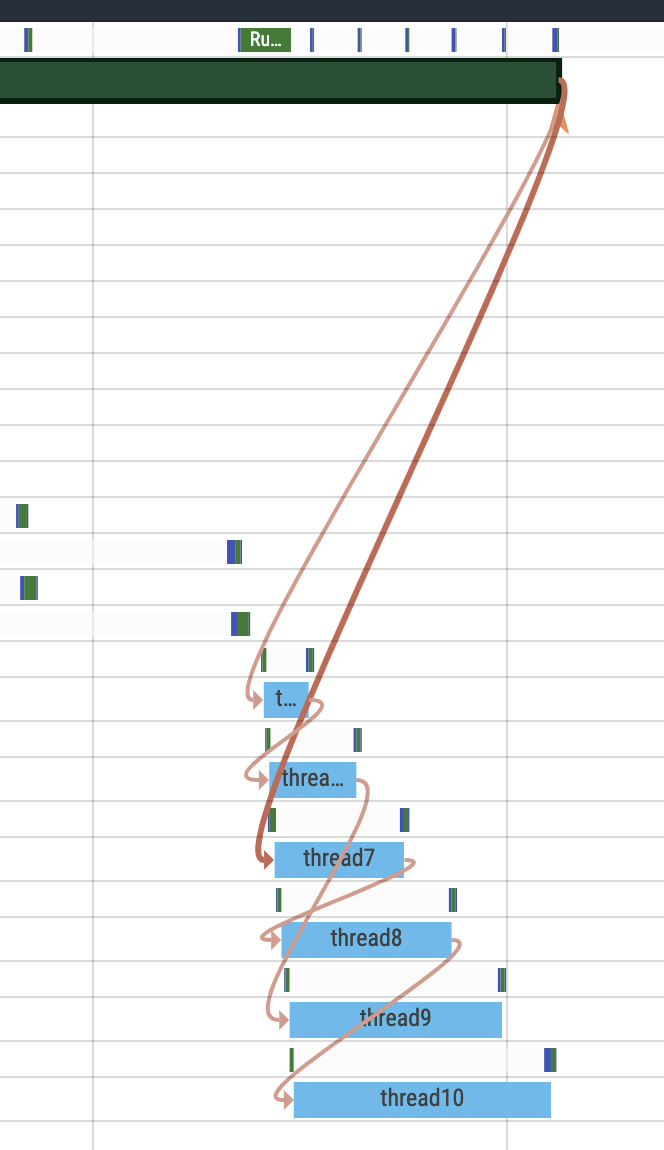
A flow event is represented as arrows in Perfetto, for example:

Async event
In a trace, instant and duration events are placed on the track of threads on
which they are produced. When working with multi-threaded async or thread pool
based code, events may be started and finished on different threads. Async
events allow specifying an id that links events across different threads
together and places these events on a single track.
An async begin (TRACE_ASYNC_BEGIN or async_begin) event may be followed by
async instant (TRACE_ASYNC_INSTANT or async_instant) events and must be
matched by an async end (TRACE_ASYNC_END or async_end) event with the same
category, name, and id.
Asynchronous events describe work which happens asynchronously and which may
span multiple threads. The id helps to correlate the progress of distinct
asynchronous operations which share the same category and name within the
same process. Asynchronous events within the same process that have matching
categories and ids are nested.
You can associate 0-15 arguments with an async event, each of which is used to annotate the asynchronous operation with additional information. The arguments that you provide to matching async begin, async instant, and async end events are combined together in the trace; you do not need to repeat them.
C
trace_async_id_t async_id = 555;
TRACE_ASYNC_BEGIN("trace_category", "trace_async_name", async_id, "argument_1", argument_1_value);
TRACE_ASYNC_INSTANT("trace_category", "trace_async_instant_name", async_id);
TRACE_ASYNC_END("trace_category", "trace_async_name", async_id);
C++
trace_async_id_t async_id = 555;
TRACE_ASYNC_BEGIN("trace_category", "trace_async_name", async_id, "argument_1", argument_1_value);
TRACE_ASYNC_INSTANT("trace_category", "trace_async_instant_name", async_id);
TRACE_ASYNC_END("trace_category", "trace_async_name", async_id);
Rust
let async_id = 555;
async_begin!(async_id, "trace_category", "trace_async_name", "argument_1" => argument_1_value);
async_instant!(async_id, "trace_category", "trace_async_instant_name");
async_end!(async_id, "trace_category", "trace_async_name");
In Perfetto, an async event is placed on its own named track and isn't placed on the track of the thread that it was emitted from. An async event looks as follows:

Arguments
You can use the following types of events in a Fuchsia trace:
- Null arguments
- Numeric types
- String types
- Pointers
- KOID
- Booleans
Null arguments
A null argument is just a name a no data.
For example:
C
TRACE_INSTANT("trace_category", "trace_name", TRACE_SCOPE_THREAD, "SomeNullArg", TA_NULL());
C++
TRACE_INSTANT("trace_category", "trace_name", TRACE_SCOPE_THREAD, "SomeNullArg", nullptr);
Rust
instant!("trace_category", "trace_name", Scope::Thread, "SomeNullArg" => ());
Numeric types
A numeric type is any int or float data type.
For example:
C
// Standard int types
TRACE_INSTANT("trace_category", "trace_name", TRACE_SCOPE_THREAD, "Someuint32", TA_UINT32(2145));
TRACE_INSTANT("trace_category", "trace_name", TRACE_SCOPE_THREAD, "Someuint64", TA_UINT64(423621626134123415));
TRACE_INSTANT("trace_category", "trace_name", TRACE_SCOPE_THREAD, "Someint32", TA_INT32(-7));
TRACE_INSTANT("trace_category", "trace_name", TRACE_SCOPE_THREAD, "Someint64", TA_INT64(-234516543631231));
// Doubles
TRACE_INSTANT("trace_category", "trace_name", TRACE_SCOPE_THREAD, "Somedouble", TA_DOUBLE(3.1415));
C++
// Standard int types
TRACE_INSTANT("trace_category", "trace_name", TRACE_SCOPE_THREAD, "Someuint32", 2145);
TRACE_INSTANT("trace_category", "trace_name", TRACE_SCOPE_THREAD, "Someuint64", 423621626134123415);
TRACE_INSTANT("trace_category", "trace_name", TRACE_SCOPE_THREAD, "Someint32", -7);
TRACE_INSTANT("trace_category", "trace_name", TRACE_SCOPE_THREAD, "Someint64", -234516543631231);
// Doubles
TRACE_INSTANT("trace_category", "trace_name", TRACE_SCOPE_THREAD, "Somedouble", 3.1415);
Rust
// Standard int types
instant!("trace_category", "trace_name", Scope::Thread, "Someuint32" => 2145);
instant!("trace_category", "trace_name", Scope::Thread, "Someuint64" => 423621626134123415);
instant!("trace_category", "trace_name", Scope::Thread, "Someint32" => -7);
instant!("trace_category", "trace_name", Scope::Thread, "Someint64" => -234516543631231);
// Doubles
instant!("trace_category", "trace_name", Scope::Thread, "Somedouble" => 3.1415);
String types
A string type is any string data type.
For example:
C
TRACE_INSTANT("trace_category", "trace_name", TRACE_SCOPE_THREAD, "ping", "pong");
C++
TRACE_INSTANT("trace_category", "trace_name", TRACE_SCOPE_THREAD, "ping", "pong");
Rust
instant!("trace_category", "trace_name", Scope::Thread, "ping" => "pong");
Pointers
A pointer is formatted in hex in the Perfetto viewer. You can also specifically specify the trace argument type when type deduction would otherwise resolve to the wrong data type.
For example:
C
TRACE_INSTANT("trace_category", "trace_name", TRACE_SCOPE_THREAD, "somepointer", &i, "someotherpointer", &i, TA_POINTER(0xABCD));
C++
TRACE_INSTANT("trace_category", "trace_name", TRACE_SCOPE_THREAD, "somepointer", &i, "someotherpointer", &i, 0xABCD);
Rust
let x: u64 = 123;
instant!("trace_category", "trace_name", Scope::Thread, "SomeOtherPointer" => &x as *const u64);
KOID
A KOID is the id of a kernel object and have their own data type to distinguish
them from regular u64 data types.
For example:
C
TRACE_INSTANT("trace_category", "trace_name", TRACE_SCOPE_THREAD, "somekoid", TA_KOID(0x0012));
C++
TRACE_INSTANT("trace_category", "trace_name", TRACE_SCOPE_THREAD, "somekoid", TA_KOID(0x0012));
Rust
let koid: zx::Koid = vmo.get_koid()?;
instant!("trace_category", "trace_name", Scope::Thread, "somekoid" => koid);
Booleans
A boolean displays as either true or false.
For example:
C
TRACE_INSTANT("trace_category", "trace_name", TRACE_SCOPE_THREAD, "somebool", TA_BOOL(true));
TRACE_INSTANT("trace_category", "trace_name", TRACE_SCOPE_THREAD, "someotherbool", TA_BOOL(false));
C++
TRACE_INSTANT("trace_category", "trace_name", TRACE_SCOPE_THREAD, "somebool", true);
TRACE_INSTANT("trace_category", "trace_name", TRACE_SCOPE_THREAD, "someotherbool", false);
Rust
instant!("trace_category", "trace_name", Scope::Thread, "somebool" => true);
instant!("trace_category", "trace_name", Scope::Thread, "someotherbool" => false);
