
Overview
Fuchsia tracing captures kernel events, one of which is named page_fault. This
event represents the duration of the time used to handle the page fault. Page
faults occur when the running process needs a page of memory to continue execution.
Enable page fault events
Page faults are handled by the kernel and are part of the kernel:vm category.
Capture the trace
For general information on Fuchsia tracing and how to capture trace events
with ffx trace, see Fuchsia tracing.
To include page fault events in your trace, specify the
kernel:vm category:
ffx trace start --categories "#default,kernel:vm"Understand a page fault event
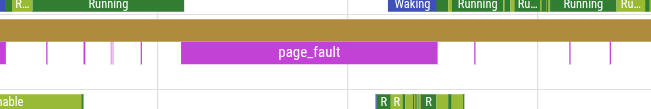
Page faults appear as slices in Perfetto.
The details of the event are shown in the bottom panel of Perfetto when you click on the slice:
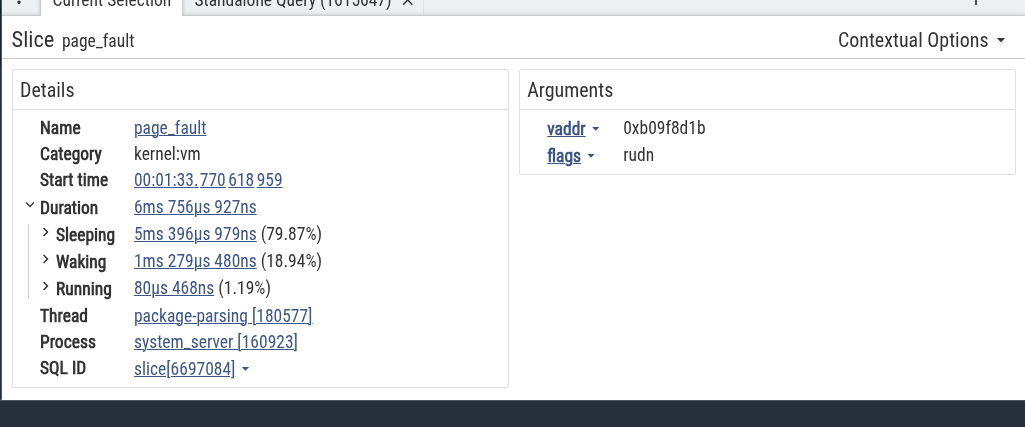
The left part of the details displays the standard properties of any slice. On the right side, there are arguments included in the page fault event.
vaddris the address of the page being processed by the page fault.flagsindicate the type of the page fault:
| Read/Write | Type | Kind | Present |
|---|---|---|---|
| Read/Write | User/Guest/System | Instruction/Data | Not Present/ Present |
See the source code for fault.h