
Components in Fuchsia may expose structured information about themselves conforming to the Inspect API. This document describes the concepts of component inspection, the interface, the C++ language implementation of the interface, and user-facing tools for interacting with components that expose information.
Quick links
Not sure where to start?
- Quickstart: A get-started guide for component inspection.
ffx inspect: Theffxcommand for inspecting components.- Codelab: A full codelab in C++ and Rust.
- API reference for C++ and Rust.
- Health checks: Describes the health check subsystem.
- Best practices: Recommendations for hierarchy design and Virtual Memory Object (VMO) sizing.
Concepts
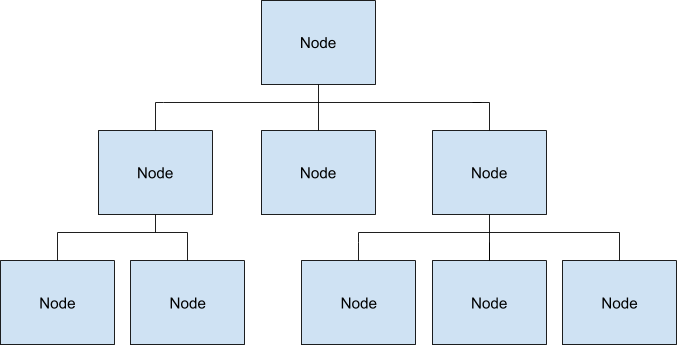
Components may expose a tree of Nodes, each of which has a set of Properties.
Node
A node is an exported entity within a component that may have 0 or more children. Each node has a name, and each child of a node must have a unique name among the children.
Property
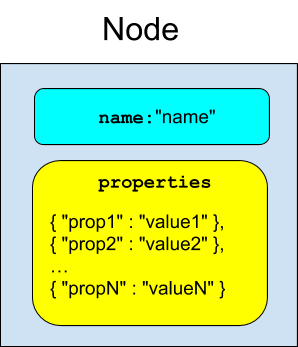
Nodes may have any number of properties. A property has a string key and a value which may be any one of a number of types:
Numeric Types
UintProperty- 64-bit unsigned integer.IntProperty- 64-bit signed integer.DoubleProperty- 64-bit floating point value.BoolProperty- A boolean value.
String Types
StringProperty- UTF-8 string.ByteVectorProperty- Vector of bytes.
Array Types
UintArray,IntArray,DoubleArray- An array of the corresponding numeric type.
Histogram Types
LinearUintHistogram,LinearIntHistogram,LinearDoubleHistogram
A histogram with fixed-size buckets stored in an array.
ExponentialUintHistogram,ExponentialIntHistogram,ExponentialDoubleHistogram
A histogram with exponentially sized buckets stored in an array.
Inspect File Format
The Inspect File Format is a binary format that supports efficient insertion, modification, and deletion of Nodes and Properties at runtime. Readers take a consistent snapshot of the contents without communicating with writers.
Filesystem Interface
Top-level nodes are exposed as VmoFiles in a component's outgoing directory
ending in the extension .inspect. It is customary for components to expose
their primary or root tree as out/diagnostics/root.inspect.
Language Libraries
C++
The C++ Inspect Library provides full writing and reading support for the Inspect File Format.
Components that write inspect data should refrain from reading that data. Reading requires traversing the entire buffer, which is very expensive.
The Inspector class provides a wrapper around creating a new buffer
with one root Node that can be added to. Nodes and Properties have typed
wrappers that automatically delete the underlying data from the
buffer when they go out of scope.
The inspect_component library provides a simple ComponentInspector
singleton interface to help with the common case of exposing a single
hierarchy from the component.
The health feature supports exposing structured health information in a format known by health checking tools.
The stats feature supports exposing runtime Inspect allocation metrics and buffer utilization.
The bounded list feature supports recording rolling event histories in fixed-capacity FIFO node buffers.
The test matchers library provides GMock matchers for verifying data that is read out of an Inspect hierarchy in tests.
Reading Support
The reading library supports parsing an Inspect File
into a Hierarchy. Hierarchys contain NodeValues
and PropertyValues, which are the parsed versions of Nodes and
Propertys respectively.
The Hierarchy's NodeValue is returned by node() and child
Hierarchys are returned in a vector by children(). The GetByPath
function supports reading a specific child hierarchy by path.
The properties for a particular NodeValue are available through the
properties() accessor. You may determine if a property contains a
certain type by passing the corresponding PropertyValue type as the
template parameter to the Contains<T>() method:
  // Returns true if the first property of the hierarchy's node is an INT value.
  if (hierarchy.node().properties()[0].Contains<IntPropertyValue>()) {
    // ...
  }
Use the Get<T>() method to obtain the property:
  // Get the IntPropertyValue of the first property on the node.
  // Note: This causes a runtime exception if the property does not contain
  // the given type, crashing the program.
  hierarchy.node().properties()[0].Get<IntPropertyValue>();
You may also switch based on the different possible format types:
  const auto& property = hierarchy.node().properties()[0];
  switch (property.format()) {
    case FormatType::INT:
      const auto& value = property.Get<IntPropertyValue>();
      /* ... */
      break;
    /* ... */
  }
Array types may be specially formatted to contain histograms. The
GetBuckets() method supports returning an array of histogram buckets
from {Int,Uint,Double}ArrayValue types. The array will be empty if
the underlying array is not a specially formatted histogram.
Rust
The Rust Inspect Library provides full writing and reading support for the Inspect File Format.
Components that write inspect data should refrain from reading that data. Reading requires traversing the entire buffer, which is very expensive.
The Inspector class provides a wrapper around creating a new buffer
with one root Node that can be added to. Nodes and Properties have typed
wrappers that automatically delete the underlying data from the
buffer when they go out of scope.
The component module supports a simple inspector function to
handle the common use of exposing a single hierarchy from the component.
The health module supports exposing structured health information in a format known by health checking tools.
The stats module supports exposing runtime Inspect allocation metrics and buffer utilization.
The contrib crate provides BoundedListNode, inspect_log!, and
time utilities for timestamped event logging.
The testing module supports the assert_data_tree! macro to
match Inspect data for testing.
Testing
Validator Architecture describes an integration test framework for Inspect language libraries.
Userspace tools
ffx inspect
To examine the inspect hierarchies of components, you can use the
ffx inspect show command:
Print all inspect hierarchies:
ffx inspect showPrint the inspect hierarchy of a specific component (for example,
core/font_provider):ffx inspect show core/font_provider
ffx inspect show also does fuzzy matching on its inputs. For example:
ffx inspect show archivist.cmThis prints all of the Inspect for bootstrap/archivist as long as this is the only component
that exposes Inspect in the system whose URL ends with archivist.cm.
Fuzzy matching will fail if the input is insufficiently specific to identify an individual component; in that case, the tool will print a list of monikers that matched the query.
In general, this command accepts the following:
A component moniker, for example,
core/network/netstack. If only the moniker is passed, collection markers don't need to be escaped, though they optionally can be.A fuzzy search parameter, corresponding to a URL fragment, manifest fragment, or moniker fragment. Ie
ffx inspect show archivist.cmforbootstrap/archivistwith the manifestarchivist.cm.A component selector, for example,
core/network/*.A full diagnostics selector, for example,
core/network/netstack:root/path/to/*:property. In the full selector case, escaping must be performed to create a valid selector.
Suppose you have the component bootstrap/driver-hosts:driver-host-337. An ergonomic way to avoid
escaping things as much as possible when you want a specific property might look like the following:
ffx inspect driver-host-337 --data root/stats:my_statffx target snapshot
ffx target snapshot generates a ZIP archive that contains the system's
diagnostic information, which includes inspect:
ffx target snapshotBest practices
Avoid nesting metrics from other components
When you design component diagnostics, keep each component's Inspect hierarchy scoped strictly to the data produced by that component. Avoid forwarding or nesting Inspect metrics from client or subordinate components under an intermediary component's Inspect tree.
Forwarding or nesting Inspect metrics under a foreign component creates several problems for tooling, debugging, and privacy compliance:
Developer experience and tooling attribution: Inspect data is attributed by component moniker. Diagnostic tools such as
ffx inspect showand automated snapshot triage query Inspect hierarchies using component monikers (for example,core/network/netstack). When you nest metrics from multiple components inside a single intermediary service, querying the producer component's moniker returns no data, while querying the intermediary returns an unmanageable aggregated hierarchy.Privacy reviews and allowlist enforcement: Fuchsia diagnostic pipelines and snapshot exporters enforce privacy controls using moniker-based selectors. Placing metrics from multiple producers under a foreign moniker obscures data origin, prevents granular data redaction, and complicates privacy review verification.
Lifecycle and failure isolation: An intermediary component holding metrics on behalf of other components can outlive or terminate independently of the actual metric producers. This creates stale diagnostics or causes data loss if the intermediary crashes.
Recommended patterns
Each component should publish its own Inspect tree directly under its own moniker.
Size the Inspect VMO to prevent silent allocation failures
Inspect hierarchies are stored in a mapped VMO using the buddy-allocated Inspect VMO format. By default, both the C++ and Rust libraries allocate a maximum VMO size of 256 KiB (262,144 bytes). Memory is committed in 4 KiB pages dynamically as nodes and properties are written to the hierarchy, up to this maximum limit.
Silent allocation failures
If an Inspect tree exceeds its configured maximum VMO capacity, or if memory fragmentation prevents allocating a contiguous block of the requested size, the Inspect library fails silently by design:
Creating new child nodes or properties fails and returns no-op objects (or stores a truncated prefix when a multi-extent string or bytes payload runs out of space on a later extent).
Appending to bounded lists (such as
BoundedListNode) still evicts the oldest entry when at capacity before attempting to allocate the new entry, and can drop the new entry or leave an empty or partially populated entry node if space runs out while recording its properties.In-place mutations on existing numeric properties, boolean properties, numeric arrays, and histograms continue to function normally.
Updating a string property or string-array slot retains the previous value if the initial string block or its first overflow extent cannot be allocated, or stores a truncated prefix if a later overflow extent fails. Updating a bytes property frees its old extents first, leaving an empty value if the first extent fails to allocate or a truncated prefix if a later extent fails.
The component does not crash or panic. Failed node and property creation is not logged; the Rust library logs an error only when
StringProperty::setfails to allocate the initial string block or its first overflow extent, or whenBytesProperty::setfails to allocate its first extent.
However, silent allocation failures mean that missing metrics or truncated historical event logs can go unnoticed during development and troubleshooting.
Detecting allocation failures with fuchsia.inspect.Stats
You can monitor Inspect memory usage and detect dropped allocations by serving
the fuchsia.inspect.Stats lazy node at the root of your hierarchy:
C++: Call
CreateStatsNode()on yourInspector.Rust: Call
component::serve_inspect_stats()to instrument the singleton component inspector, or on a customInspectorcallrecord_lazy_stats().
When you query the component with ffx inspect show, the
fuchsia.inspect.Stats node displays real-time allocation metrics:
ffx inspect show <moniker>:root/fuchsia.inspect.StatsThis command outputs metrics similar to the following:
fuchsia.inspect.Stats:
  allocated_blocks = 142
  current_size = 36864
  deallocated_blocks = 28
  failed_allocations = 0
  maximum_size = 262144
  peak_bytes_requested = 34560
  total_dynamic_children = 1
  utilization_per_ten_k = 1406
A non-zero value for failed_allocations indicates that Inspect has exhausted
its VMO capacity and dropped data. peak_bytes_requested reports the
high-watermark of concurrently requested bytes. Requests that failed still
count toward it and are never released, so repeated failed allocations
inflate the value beyond the true peak demand. You can use this value as a
hint for how large the Inspector VMO would have needed to be to avoid
failing allocations.
Sizing recommendations and configuration
When designing component diagnostics:
Estimate buffer requirements: If your component records historical event logs using bounded collections (such as
BoundedListNode), calculate the expected memory footprint (entry count × average entry size) or inspectpeak_bytes_requestedinfuchsia.inspect.Stats, and ensure the VMO is sized with adequate headroom.Configure custom VMO capacity: When 256 KiB is insufficient, initialize the Inspector with an explicit size:
C++: Construct an
inspect::Inspectorfrom aninspect::InspectSettingsstruct withmaximum_sizeset. To publish it throughinspect::ComponentInspector, pass thatInspectorin theinspectorfield ofinspect::PublishOptions.Rust: Call
fuchsia_inspect::component::init_inspector_with_size(max_size)before any other use of thecomponentsingleton (inspector(),health(), orserve_inspect_stats()), or configureInspectorConfigviaInspector::new(InspectorConfig::default().size(max_size)).
Use lazy nodes for large or dynamic datasets: Offload large collections (such as routing tables or detailed cache entries) to lazy nodes so they are computed on demand rather than permanently occupying VMO space.
For concrete code samples on configuring VMO size and serving stats, see Managing VMO size and capacity in the Quickstart guide.